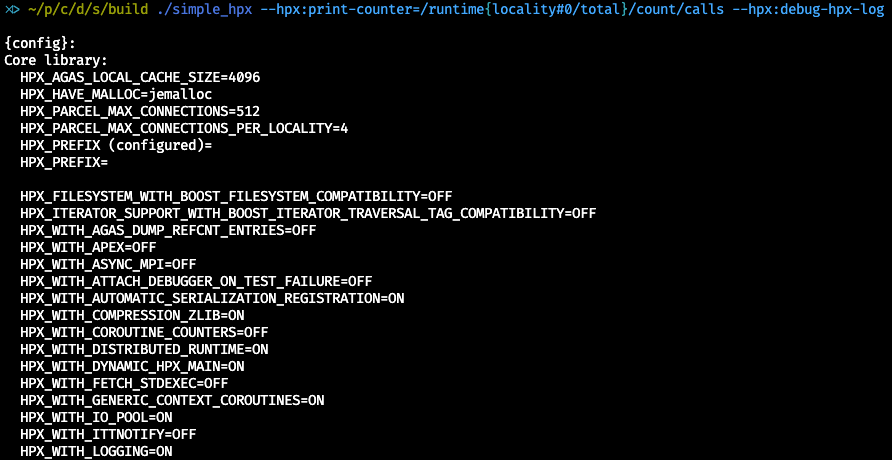
11 minutes read
In this article we’ll explore Microsoft’s Azure Machine Learning environment and how to combine Cloud technologies with Python and Jupyter. As you may know I’ve been extensively using them throughout this article series so I have a strong opinion on how a Data Science-friendly environment should look like. Of course, there’s nothing against other coding environments or languages, for example R, so your opinion may greatly differ from mine and this is fine. Also AzureML offers a very good R-support! So, feel free to adapt everything from this article to your needs. And before we begin, a few words about how I came to the idea to write about Azure and Data Science.
Being a datascientific Loser is OK but what about a Beginner Data Science-Certificate?
I’ve started to write on Data Science because I thought that the best way to learn about something is actually to write about it. No matter how little your current knowledge is the writing itself will surely help to increase it. It may take some time, of course, and there’ll be many obstacles waiting to stop your progress. But if you persist in sharing your knowledge, no matter how small it is, you’ll prevail and gain more confidence. So you may continue your learning journey.
And as I wrote in the original article our industry, IT, has big problems with naming things. Just take a few buzzwords from the last decade and you’ll know what I mean. However, naming things may be wrong but this is more an “internal” problem of the IT and people not involved in our business can happily ignore it. Something completely different happens when you start to compare human beings to animals, that is give people animal names. This is not only misleading but also a dangerous trend, in my opinion. There may be a shortage of qualified Data Scientists (and the fact that amateurs like me write lengthy articles on DS is one of the symptoms) but describing the complexity of DS by using animal terms is something we should be worry about. Starting to compare people to unicorns will sooner or later end with comparisons like pigs, rats and other, less lovely terms. Nothing can escape duality and IT, as we all know, is dual to the core. Failure and Success, 0 and 1, Good and Bad. The industry is now fervently searching for unicorn data scientists, but sooner or later they’ll also have pig & rat data scientists producing miserable models, incapable algorithms and misleading predictions. Just like we already have coding monkeys writing code that incurs technical debt.
Maybe I’m taking a rather unimportant term too seriously, I don’t know. However, I think that such a powerful and influential industry like IT should think more thoroughly about the message it sends to future talents.
Now, let’s talk about something more positive! 😀
There’s a course at edX called “Data Science and Machine Learning Essentials” provided by Microsoft. It’s a 4-Week practice-oriented course created by Prof. Cynthia Rudin and Dr. Stephen F. Elston. I can’t remember how I found it because I wasn’t actively searching for any datascientific courses but in the end I registered a seat and, to my surprise, found out that Azure ML supports Jupyter! It wasn’t the mere Python language support that made me enthusiastic about Azure ML but the direct, out-of-the-browser access to a proper Jupyter environment. Currently, Azure ML supports Python and R as its primary languages but if you know Jupyter you surely can imagine working with Julia, Scala and other languages as well. And this is the reason why I’m dedicating this article to Azure ML. Everything I’ll present here will be based on what I’ve learned from the lectures. You can register for free and earn a certificate until March 31st 2016. I’d recommend you to buy the Verified Certificate because it supports edX which is a non-profit organization.
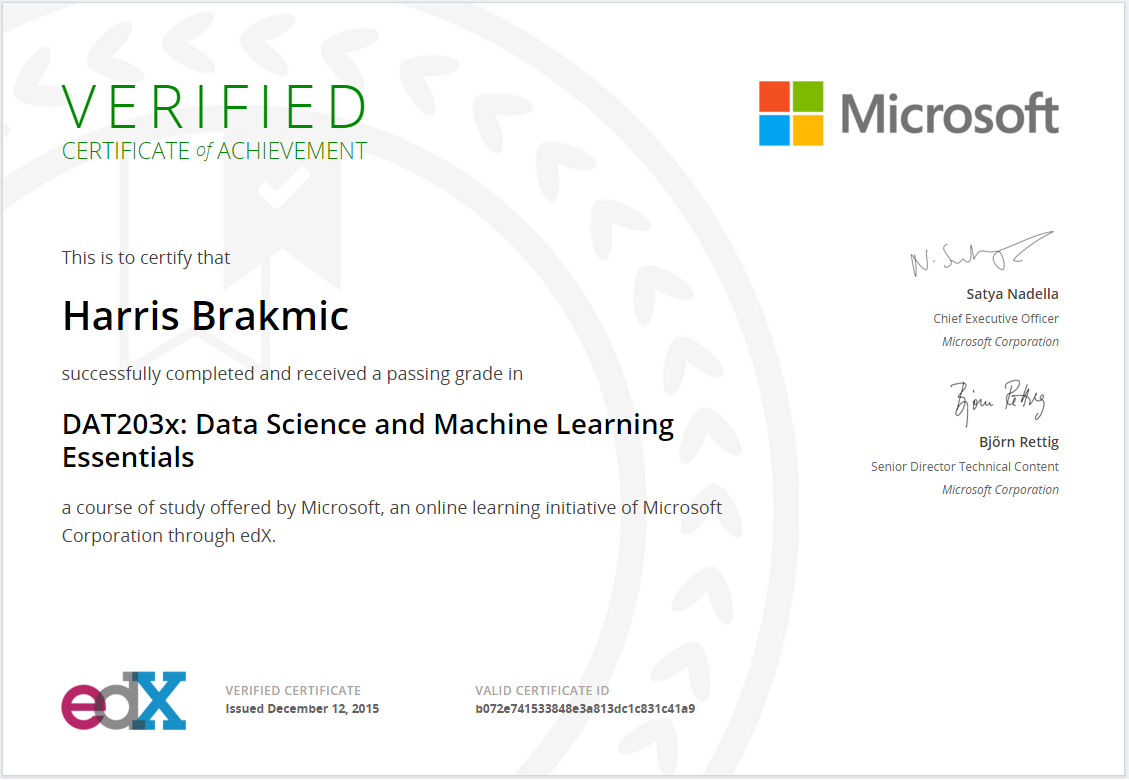
And just to provide evidence that I’m supporting edX here’s my certificate (yes, I’m bragging about myself):
And just for those of you who’d rather like to learn with R: there’s a free eBook from Dr. Elston called “Data Science in the Cloud with Microsoft Azure Machine Learning and R“.
Now let’s begin with Azure ML. 🙂
Azure ML Registration and Basic Instruments
First, we’ll need a proper account which you can get completely for free at bit.ly/azureml_login
Just click on “Get started” and create a test account.
The environment doesn’t expire after some “testing period” which is really nice but you should know that you’ll not be running the fastest possible hardware so the execution performance of your models won’t be “state-of-the-art”. However, for exploratory tasks and overall learning experience this free access is more than enough. The start page of Azure ML looks like this:
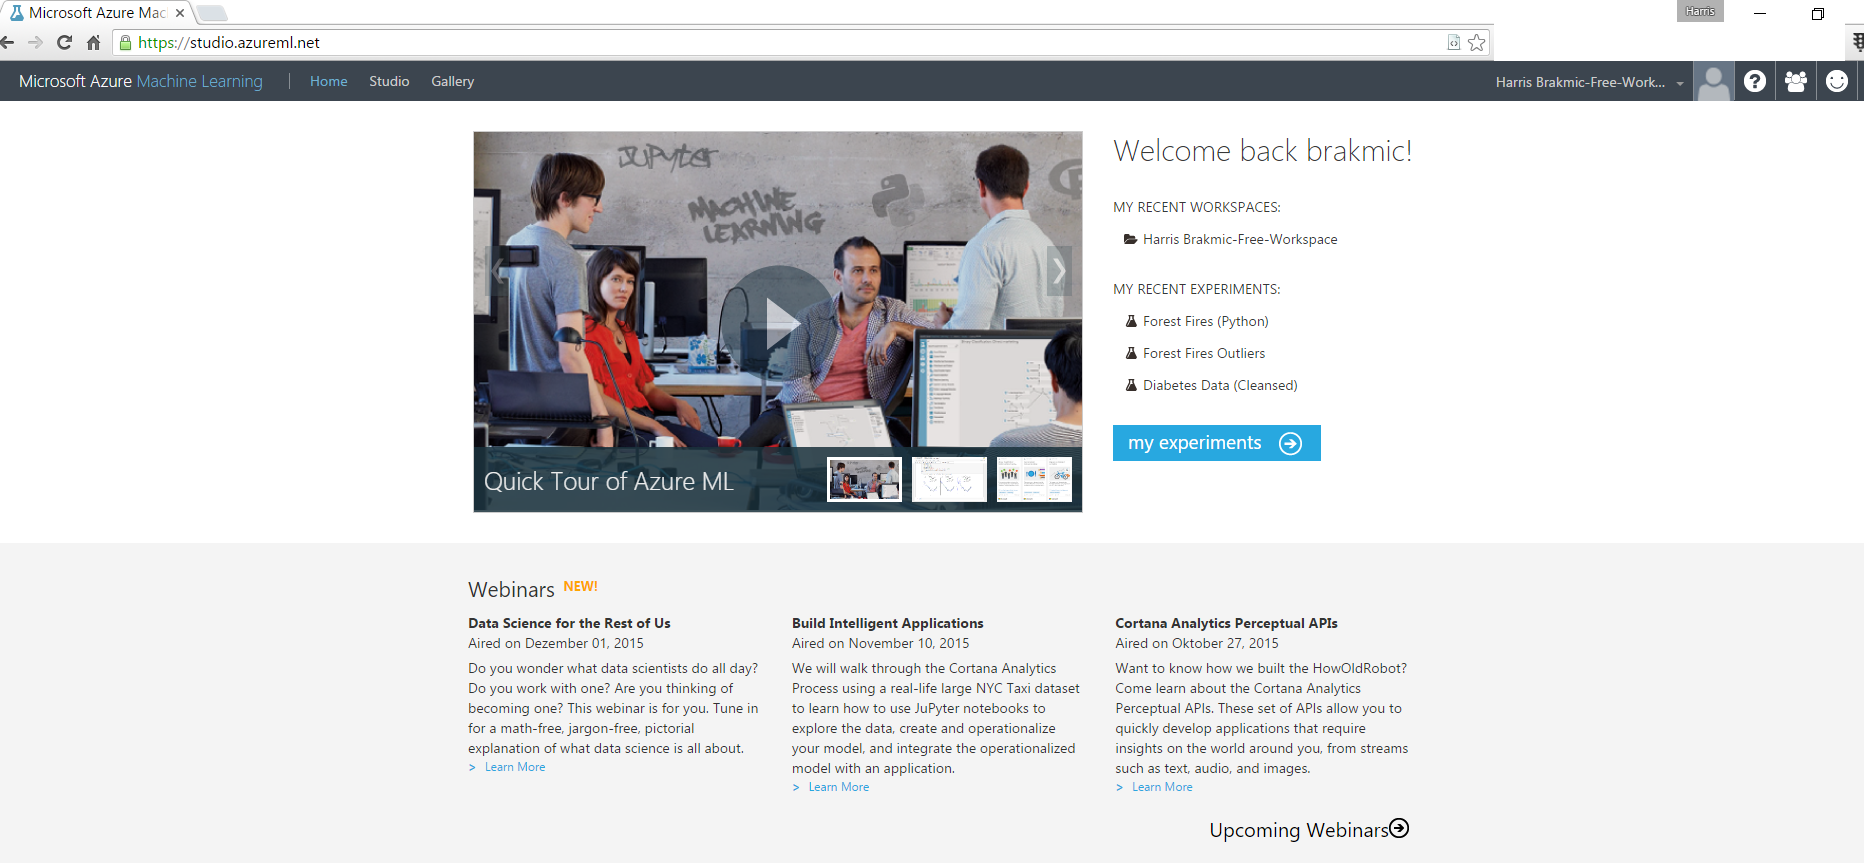
You can see my Workspace and a few Experiments in my recent experiments list. The first thing you should know is the Azure ML naming of things: an Experiment is basically a Workflow you create to consume, process and manipulate data to get some insights from it. Therefore, an experiment is a collection of interconnected steps you create via drag & drop and you can also extend them providing code that can be written in Python, R or SQL (or in any combination of them). It’s also possible to create Web Services based on your generated models that can be used by your customers.
This is the toolset from Azure ML where I manage my experiments:
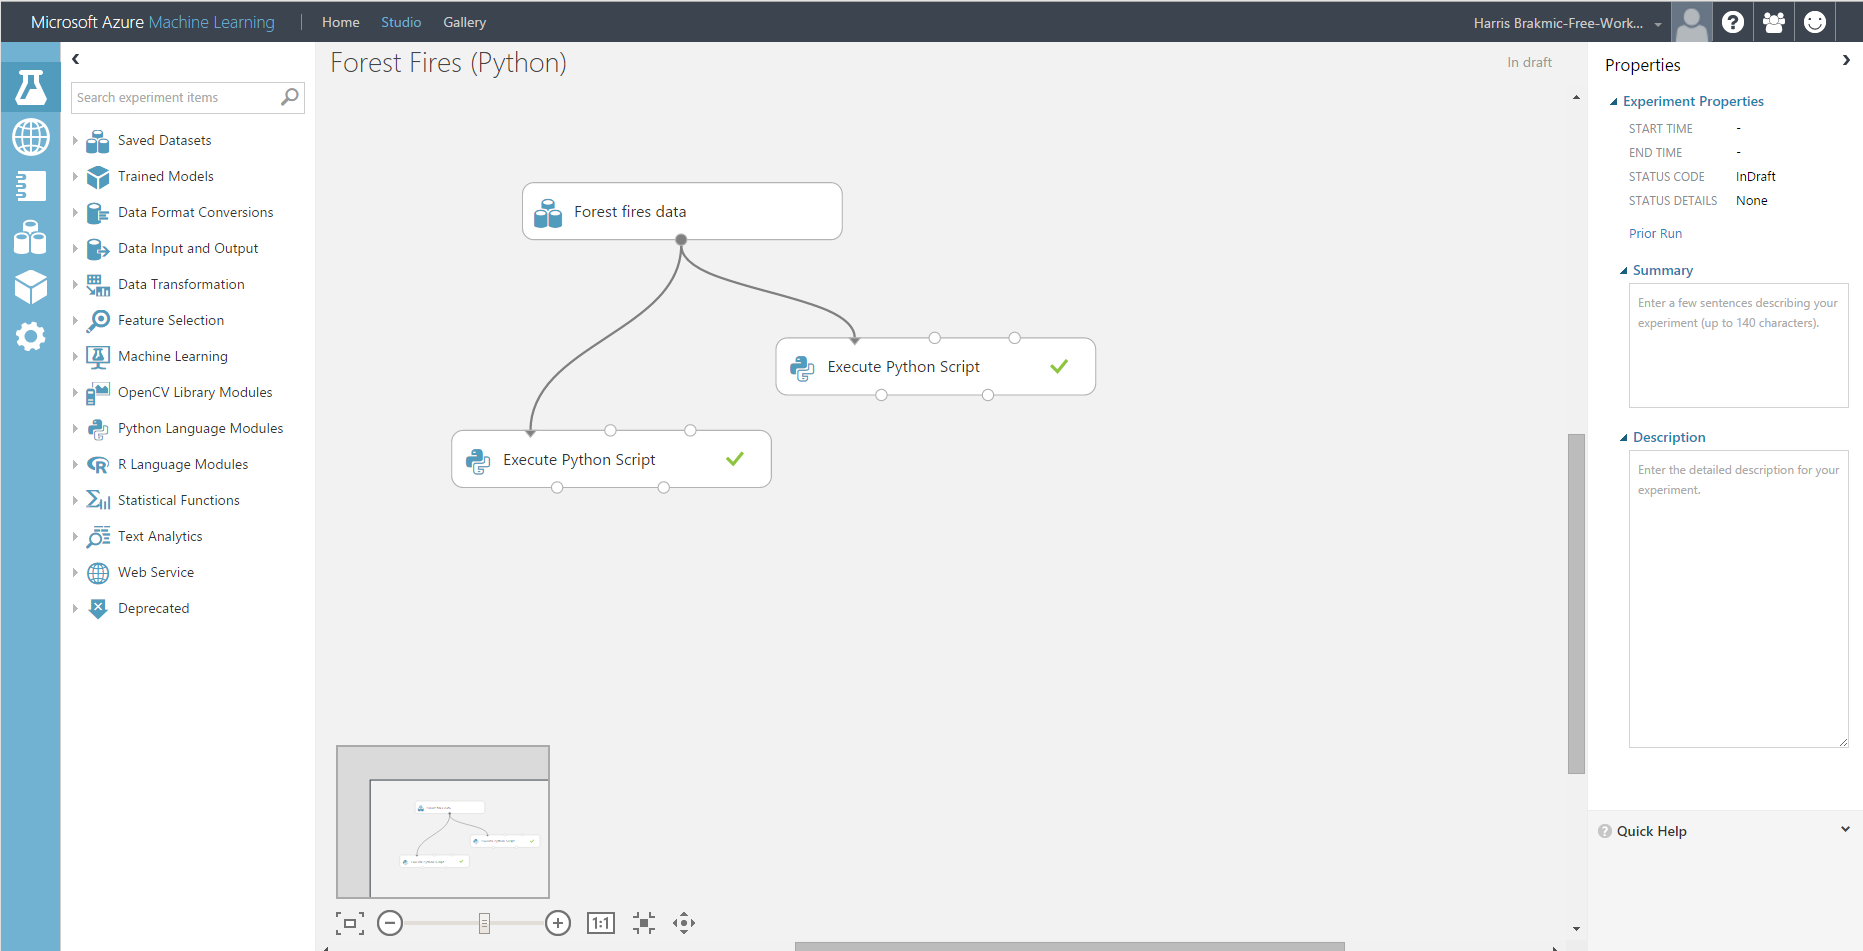
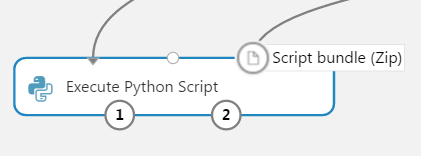
In the left sidebar are the tools, datasets, models, functions, web services etc. located. This is the place where you select you preferred models, your scripts (Python/R/SQL) and everything else related to data and its manipulation. In the middle you see the logic of the datascientific workflow you create by dragging & dropping of elements from the left. On the right you can tweak the different settings of a selected Workflow step. Most of the steps usually produce some outputs that’ll be processed further by subsequent steps. In such cases you combine the output-input-flows by dragging a line from little circles between those steps. Many modules have more than one “input circle” which means that they can process more than a single input. For example, the Execute Python Script module can receive two data sets and also a zipped script file containing some additional programming logic written in Python.
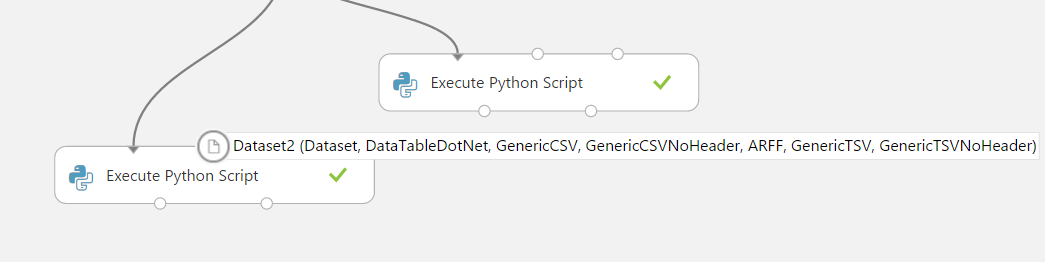
Also, modules can have more than just one output. Again, the Execute Python Script module can output new datasets but also create plots:
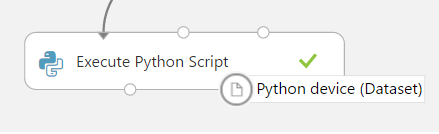
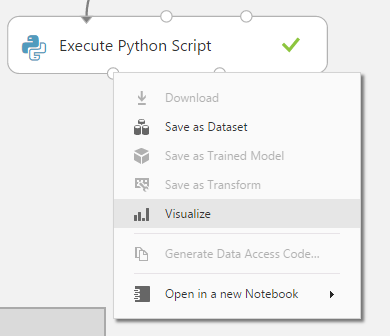
To execute the functionalities provided by these modules you have to right-click on the circle and choose the option from the context menu. Here I’m selecting the Visualize option to get a tabular view of the output dataset.
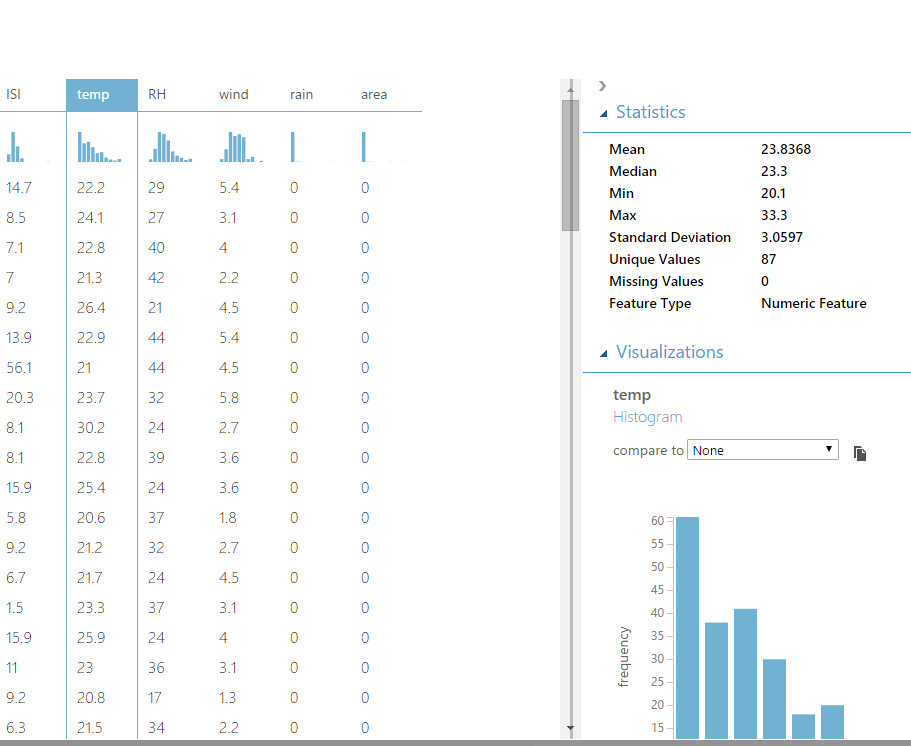
This is how a visualized dataset in Azure ML looks like:
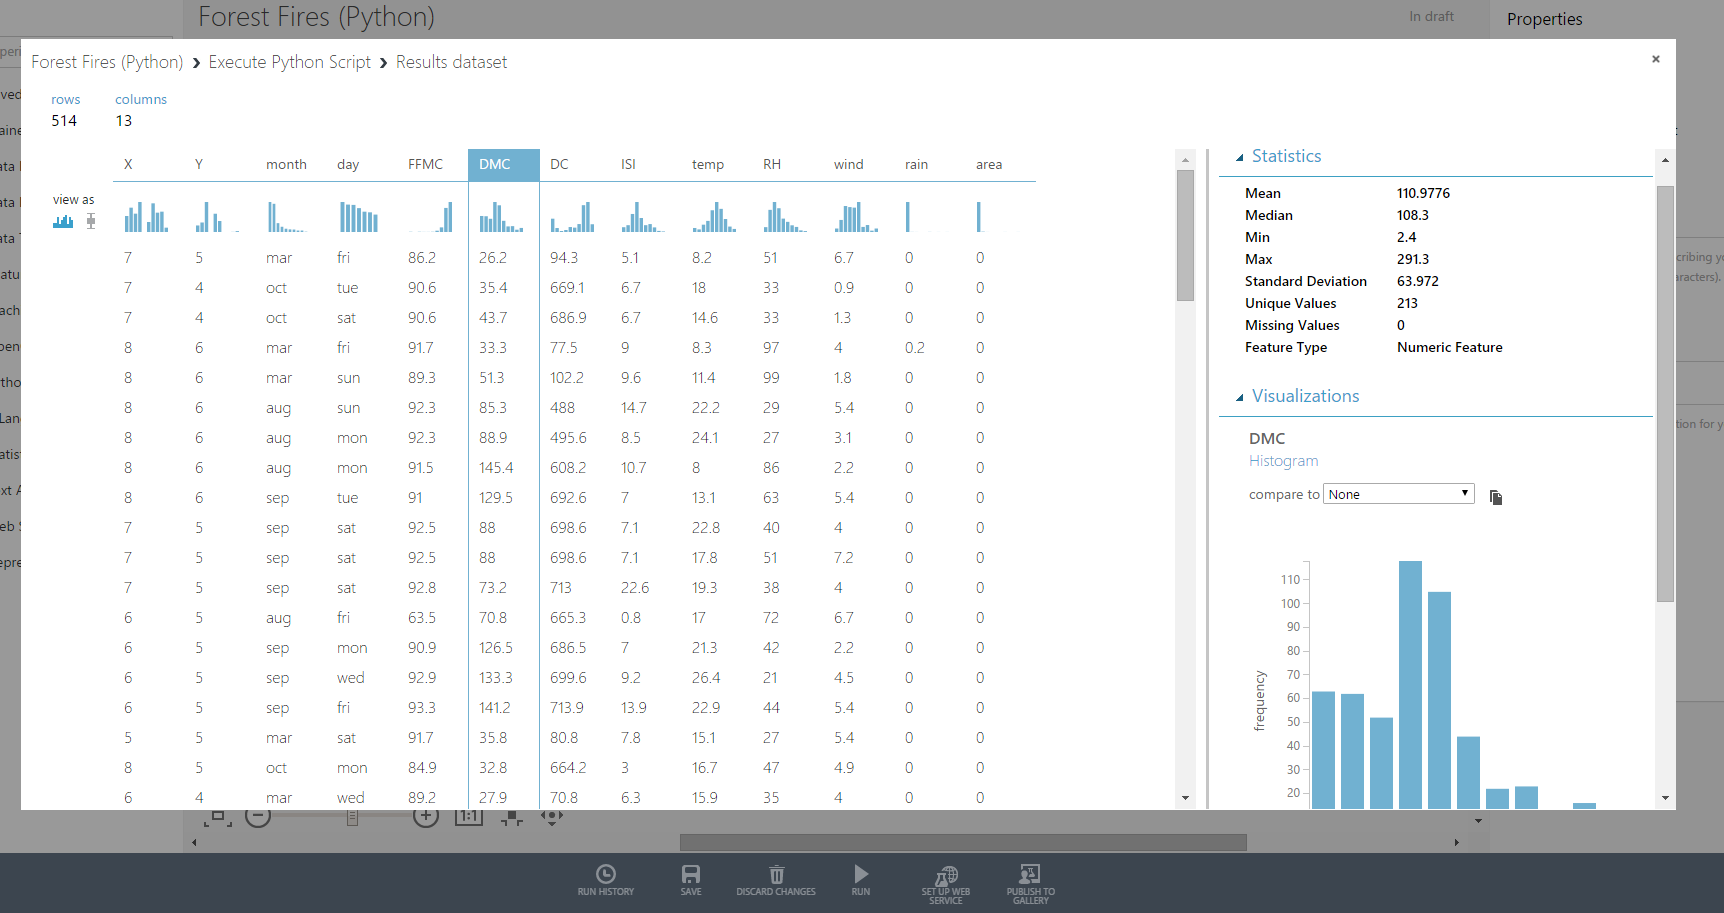
You gain direct insights of your data, like count, mean, median, max, min. Also about missing data, what type it is (Numeric, Categorical). One really nice feature is the direct graphical representation of single columns. Under each column name you see little bar-charts which help you recognize their distributions. Another very helpful feature is the “compare to” on the right side. You select a column in the list and then compare its values to another column you select in the dropbox on the right.
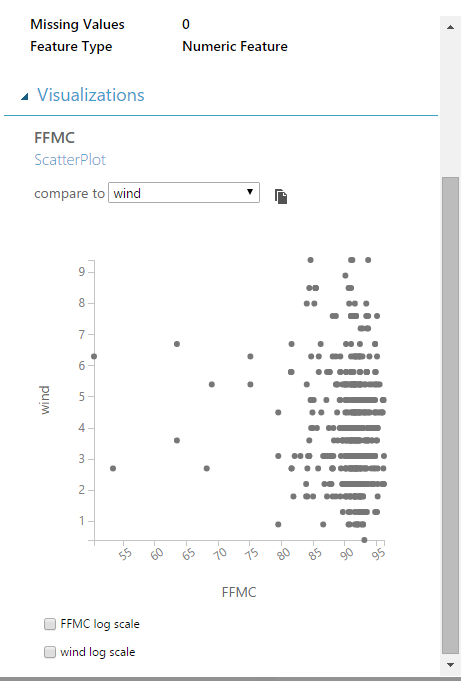
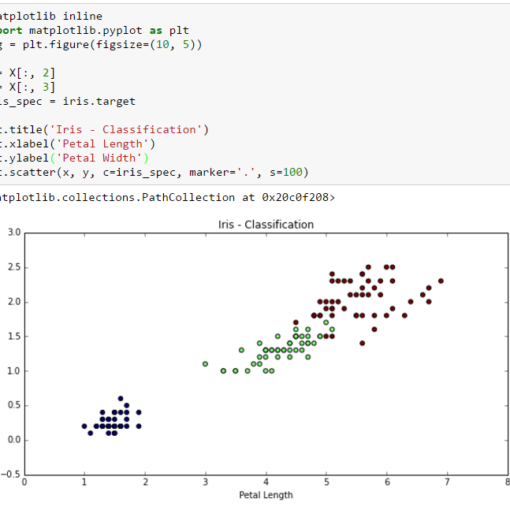
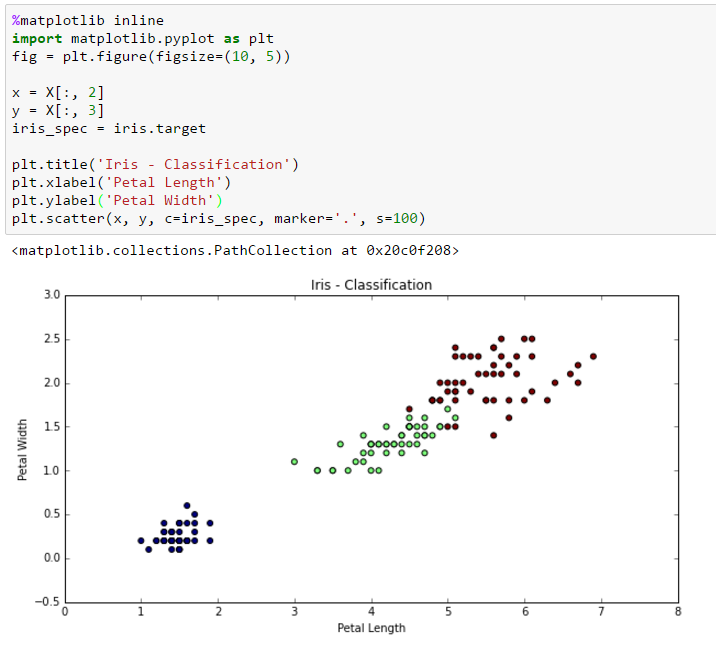
You can also graphically visualize datasets by executing your own Python (or R) scripts. Here’s an example with several scatterplots:
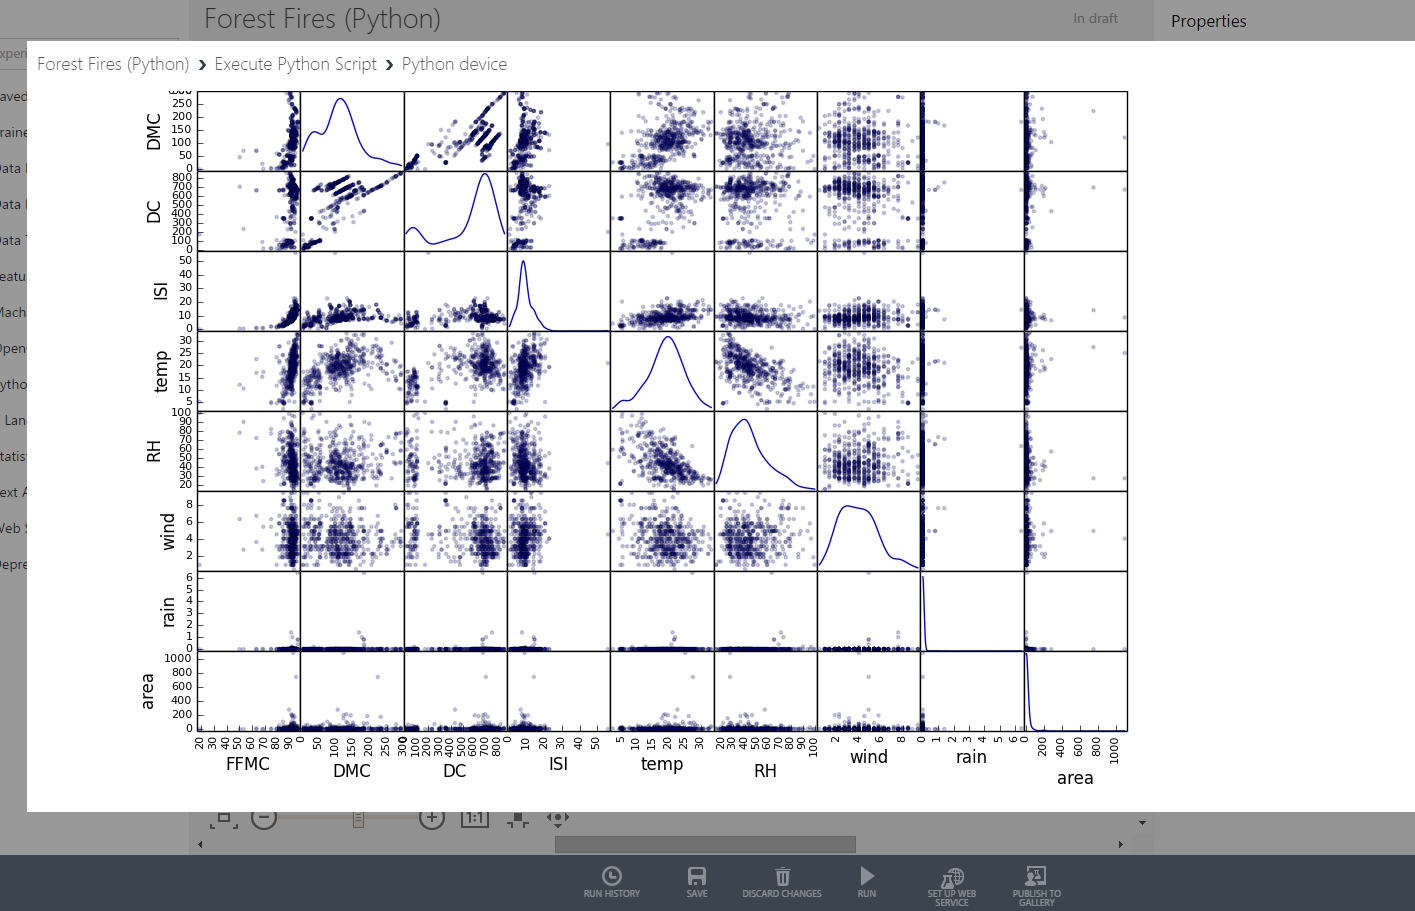
The scripts you provide are being executed directly by the Cloud Environment and must contain the azureml_main function so Azure ML can execute the scripts. To properly handle datasets you must import Pandas. For plotting you use matplotlib. If you’re new to Pandas then you may want to read one of the previous articles from this series.
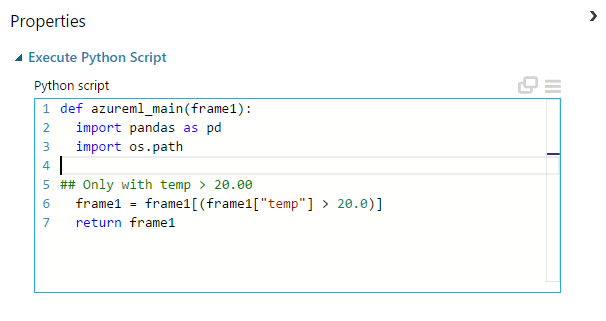
This is how a rudimentary script should look like (the amount of input parameters depends on the actual task)
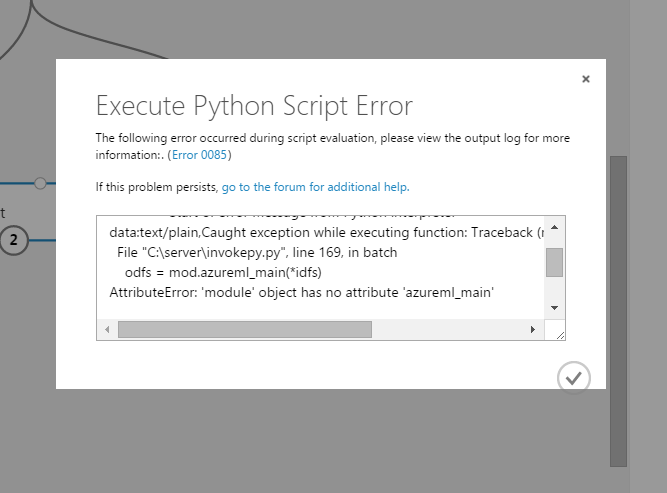
Take care of correctly naming the function. This is what would happen if you’d try to omit azureml_main:
Now you’re ready to execute the experiment. In this case it comprises of three steps:
- Getting data
- Executing 1st Python Script
- Executing 2nd Python Script
Click on RUN in the status bar and wait for experiment to complete:
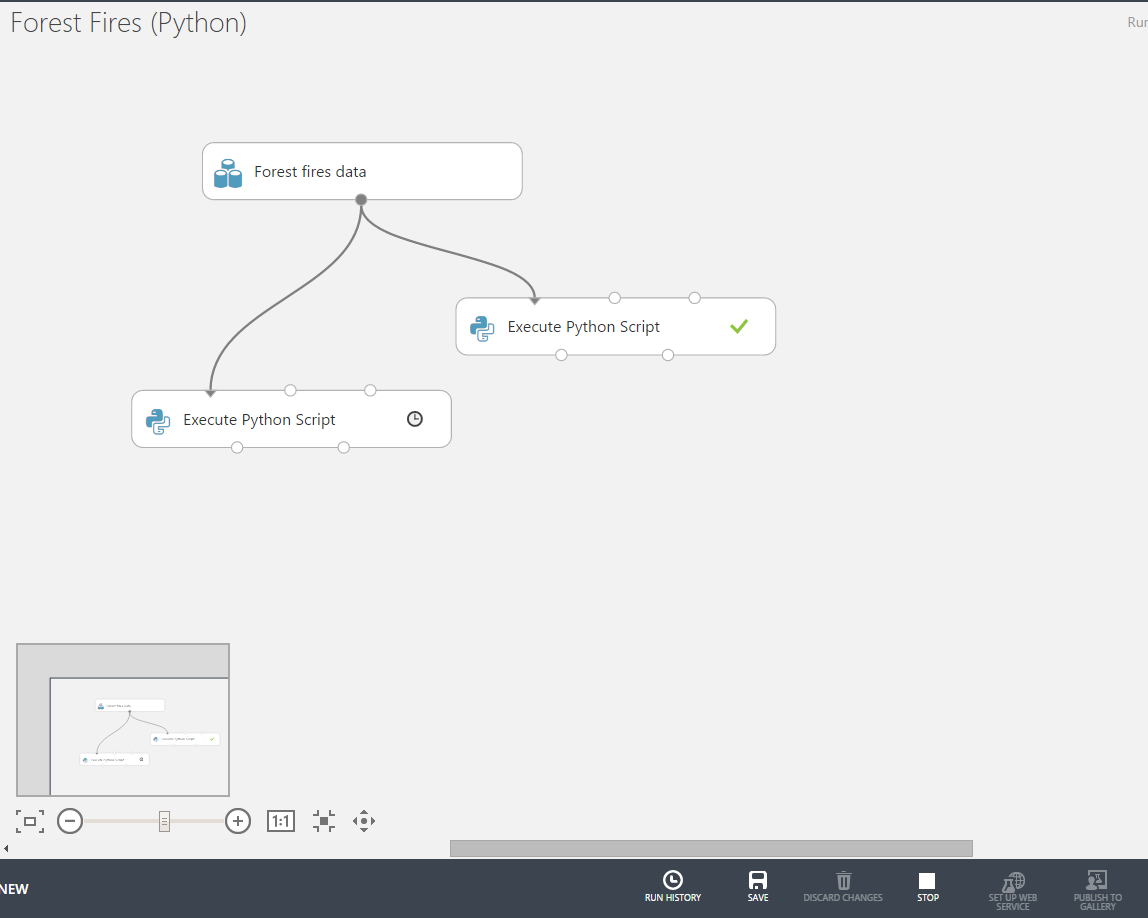
A successful completion of each of the steps will be signed with a green check mark. Currently running scripts show the “hour” icon. We now go to the second script that contains our filtering code and visualize the results. We see that there are no temperatures smaller than 20.0 degree (look at the Min-values indicator on the right).
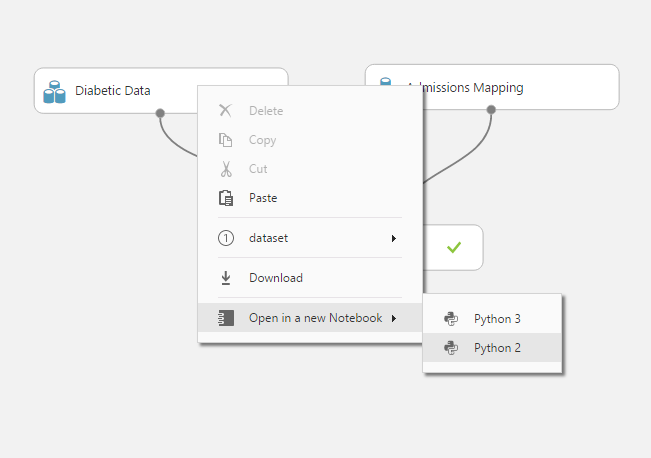
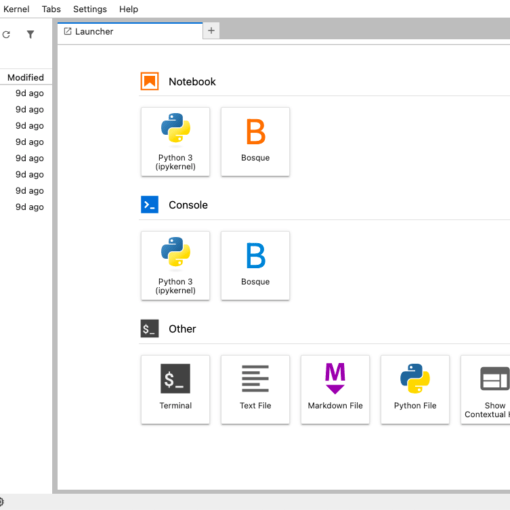
Using Jupyter in Azure ML
For me, the most exciting part is the ability to quickly switch to Jupyter and work on the same dataset.
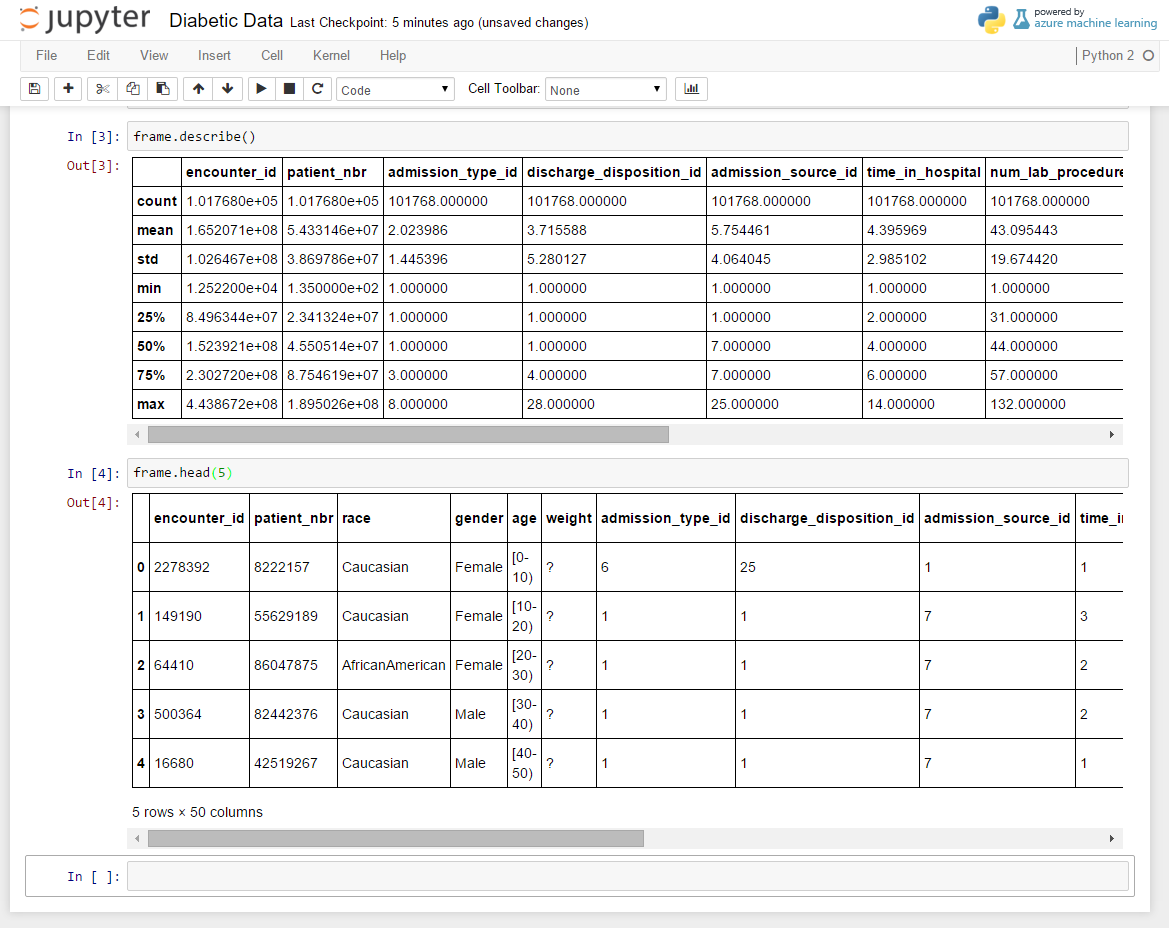
After a few moments the familiar interface will show up:
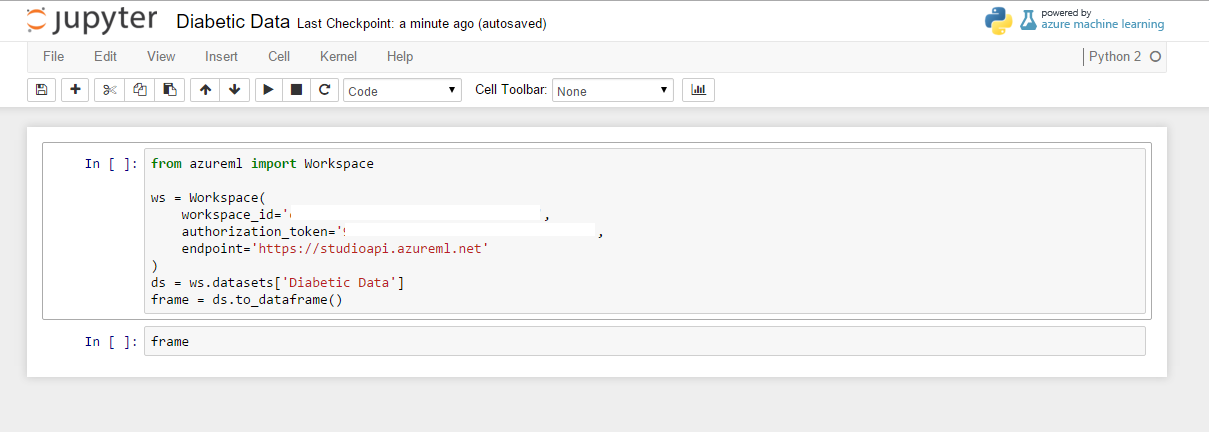
Now you can work on datasets from Azure and completely ignore the underlying environment. You don’t even need Windows to use Azure ML, of course. This means, just ignore the fact that this blog’s writer is still using Windows. 
Importing Scripts
Azure ML tool-set is very intuitive and easy to use. Just type in a term in the search field above the modules list and you’ll surely find the right one. Also, you can very easily pack your own scripts into Zip-files and upload them as your own modules. Just write a Python script containing the logic you want to reuse, zip it and upload it to Azure ML. That’s all you have to make your script become a part of your datasource list. You can now use it in your experiments.
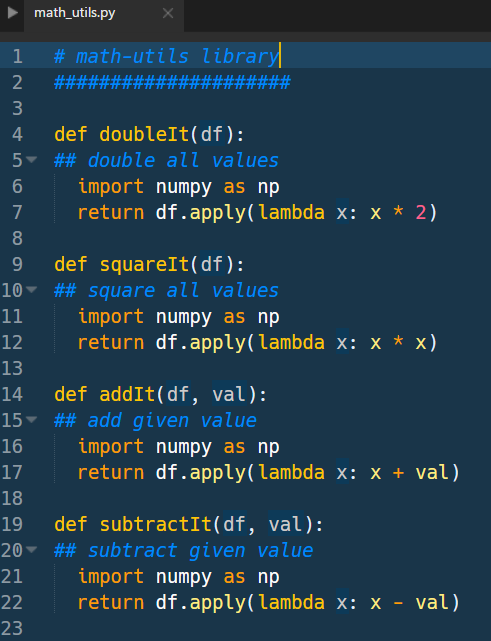
Here we define a small math-utils library and zip it subsequently. The numpy library is not being directly used in the functions and serves just as an example that you can reference additional libraries for internal access.
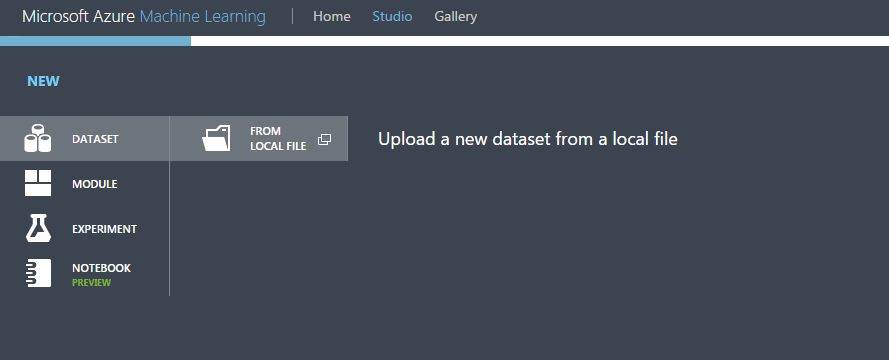
We click on NEW in the status bar and choose DATASET from local file.
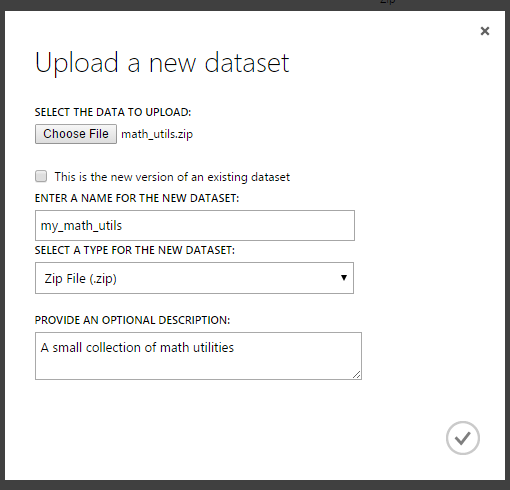
In the file dialog we select our zipped file and wait for upload to complete.
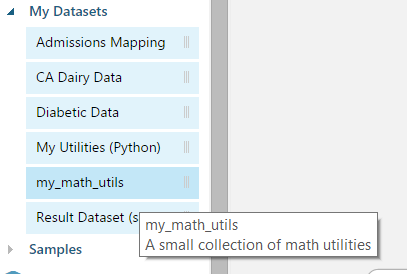
Our new utility library will now show up in the list of datasets:
We drag & drop the new module and connect it to another Execute Python Script module in the experiment. The source of this module is expanded accordingly. The namespace of the referenced module is the original file name of the zipped python script.
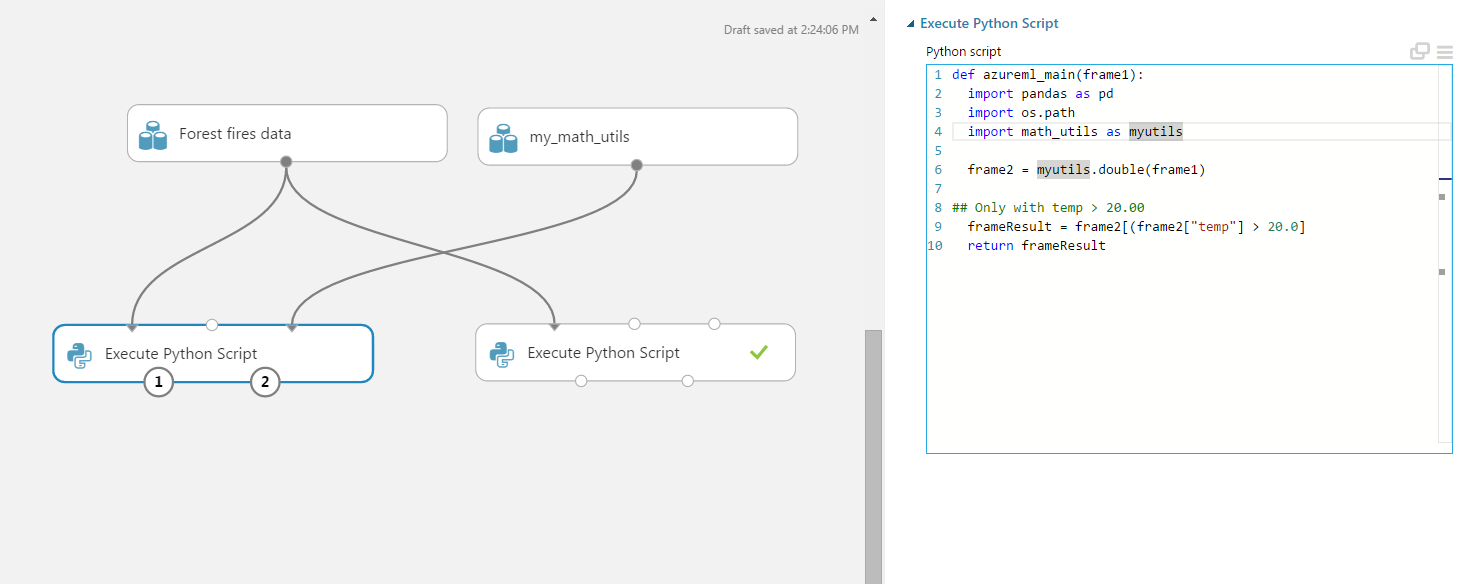
Here you should take care of connecting the utility script to the third of the available circles of the target module.
Now you can save and execute the experiment. Please note that I’m providing here just a contrived example to show you how this mechanism works.
Conclusion
Azure ML is an exciting environment for datascientific work and what I’ve provided here is just a tiny overview of some of its many features. And again, I recommend you to take a seat in the aforementioned course and learn everything needed to effectively work with Azure ML. Alternatively you can also watch this video from Dr. Elston about Data Science with Cortana Analytics where he explains in great detail the structure of Azure ML and how to use it effectively.
One thought on “Data Science for Losers, Part 6 – Azure ML”
Very nice write up!