
13 minutes read
Let me start this article describing the problem I had with finding a proper title for it. As some of you may already know I write a series called “Data Science for Losers” which comprises of several articles that describe different tools, methods and libraries one can use to explore the vast datascientific fields. And just a few days ago, while finishing my Data Science and ML Essentials course, I discovered that Azure ML has a built-in support for Jupyter and Python which, of course, made it very interesting to me because it makes Azure ML an ideal ground for experimentation. They even call one of their working areas “Experiments” so one can expect good Python (and R) support and many cool off-the-shelf modules. Being no different than other tech-enthusiasts I quickly decided to write an article describing some of the key parts of Azure ML. But sadly, I was a little bit too enthusiastic and missed one of the key points every good tech article should have: to provide or at least describe a working demo! 😳
Maintaining a Blog named “Coding” and forgetting to provide a working demo for an article surely qualifies me for the title of a “General Loser” so there’s no need to hide behind the datascientific curtain. 
OK, enough with the jokes. Let’s experiment with Azure ML by training two models with Linear & Forest Regression and deploying a Predictive Web Service.
Data, Data, Data
Being no different than other environments for predictive analytics Azure ML needs some data to setup, train and deploy proper models. For the purposes of this article we could drag & drop one of the available demo models directly from Azure ML toolbar but I think it’s way better to go somewhere else and just download a CSV file. We’ll download a well known Boston Housing Data Set from this web site. There are many other data sets available, so there should be no shortage of ideas for some additional experiments. After having downloaded this CSV file we log-on to our Azure ML account and upload the data set. If you don’t have an account just create one for free. You can check my last article on how to register at Azure ML.
In the main page click on NEW on the status bar and then DATASET / FROM LOCAL FILE

Select the downloaded CSV file and give it some meaningful name because it’ll be displayed among your other files.

Later you’ll see it in the list of available data sets.

Experimenting with Data
I’ll avoid theorizing about Data Science for a simple reason: there’s enough material out there and I’m surely not experienced enough to say what’s right or wrong.
At the beginning we should try to find out what’s inside our data, visualize it, see if there are any anomalies, try a few queries etc. Some of these things I’ve already described in the last few articles, therefore we’ll now go more straightforward and try to build and train two models by using Linear and Decision Forest Regression. After having trained them we’ll score and evaluate them to find out which one performs better so we can build and deploy a predictive web service based on it. Finally, we’ll see how we can remotely access this web service by using some cool tools.
Azure ML makes it possible to literally drag & drop complete logic for building predictive models. Of course we start with our own data and put the Boston-Model at the top in our new Experiment. To start a new experiment go again to NEW at the bottom and this time select Blank Experiment.

We use our new Boston Model. All experiments begin with a data set. Most of the modules need some sort of input data so we have to begin with a data set.

We should also change the name of the experiment to something more meaningful. Just replace the default-name “Experiment created” by something you prefer. The next module we’ll need is the Split-Module because we want to train our model based on training data that is separate from test data. Experienced Python or R users surely know the functions like “test_train_split”. The Azure ML Split Module is no different. You include it in the experiment and connect the output circle of the data set with the input circle of Split. This is nothing else but making a statement that you want Azure ML to split your data set in two parts, training and test data.
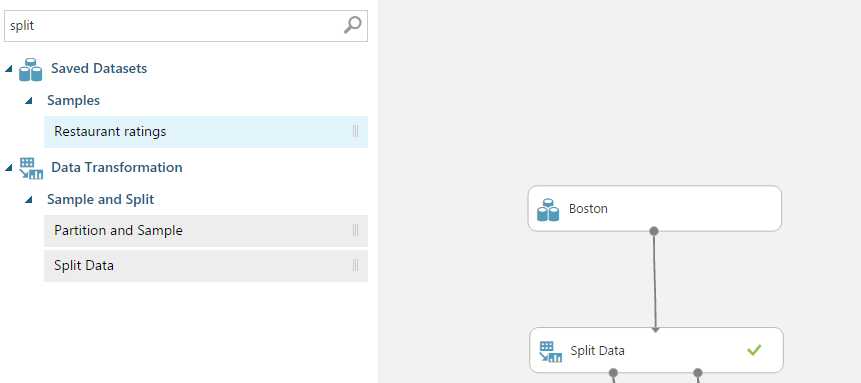
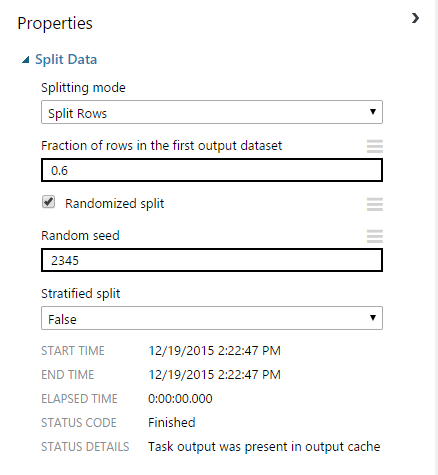
You can also change the properties of the Split-Module. For example the amount of rows in the first output (training data set). Just click the Split icon to show its properties on the right side of the dashboard.
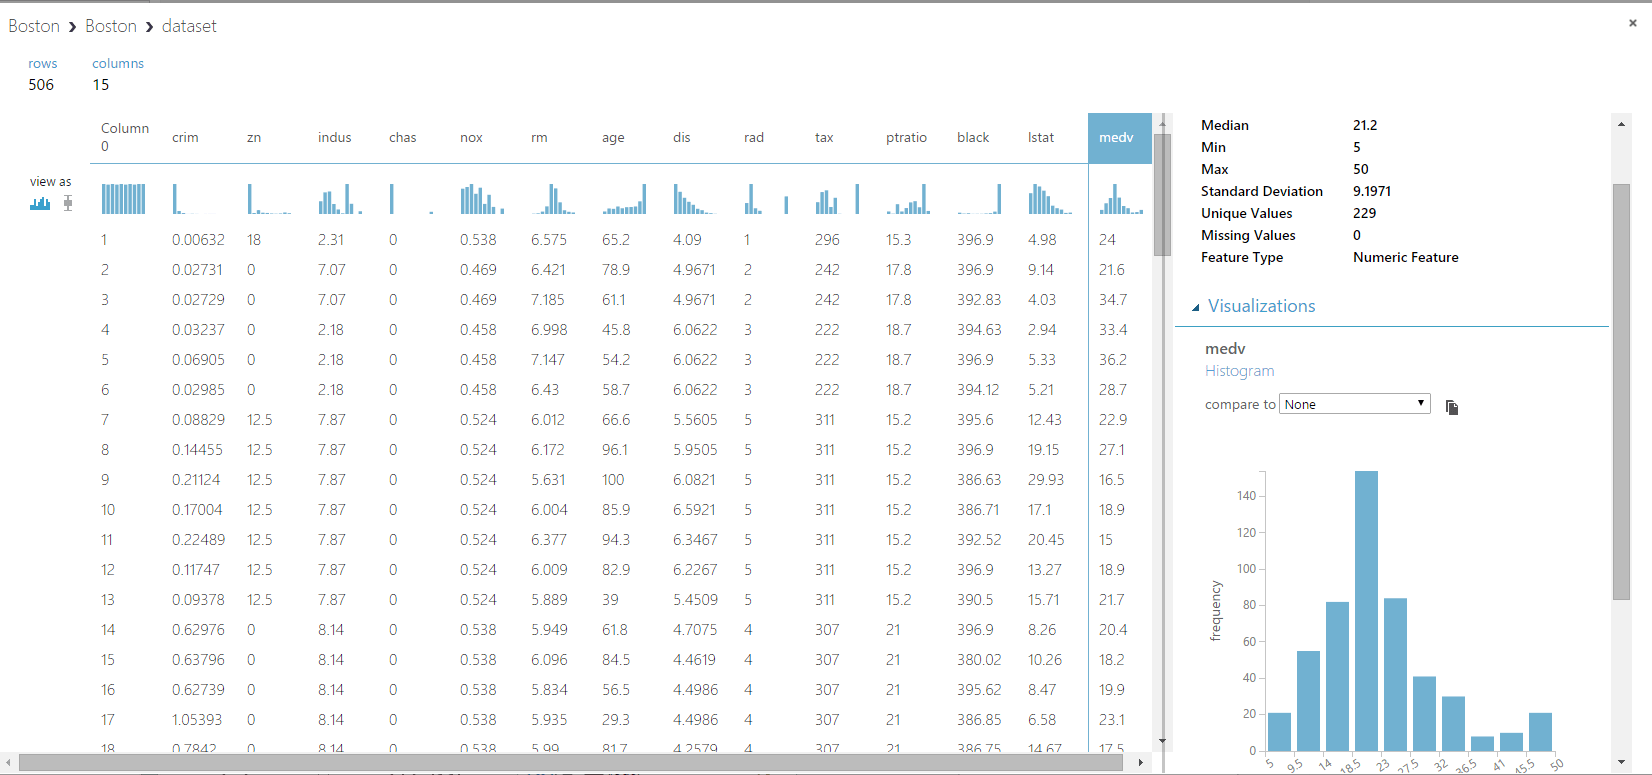
We now have defined our training and test data. The next thing we need is the way to analyze these data sets. As we surely know there are many ways to make predictions: we can classify our data, execute different regressions, try to generate clusters, build recommendations systems etc. It really depends on the data you have and the questions you ask. I’ve tried to describe some key parts of all these Machine Learning Algorithms in one of my previous articles, so you can read it just in the case you’re totally new to ML. When it comes to Boston data set we clearly have to deal with some kind of Regression because the labels we’re searching for are continuous values (housing prices in this case). The features in this data set provide information describing the housing values of different suburbs of Boston (per capita crime rate, proportion of non-retail businesses, average number of rooms per dwelling etc.). Combined together they influence the housing prices. And our task is to estimate a housing price when only features are given (that is, without the last column medv which stands for median value of owner-occupied homes in $1000’s).
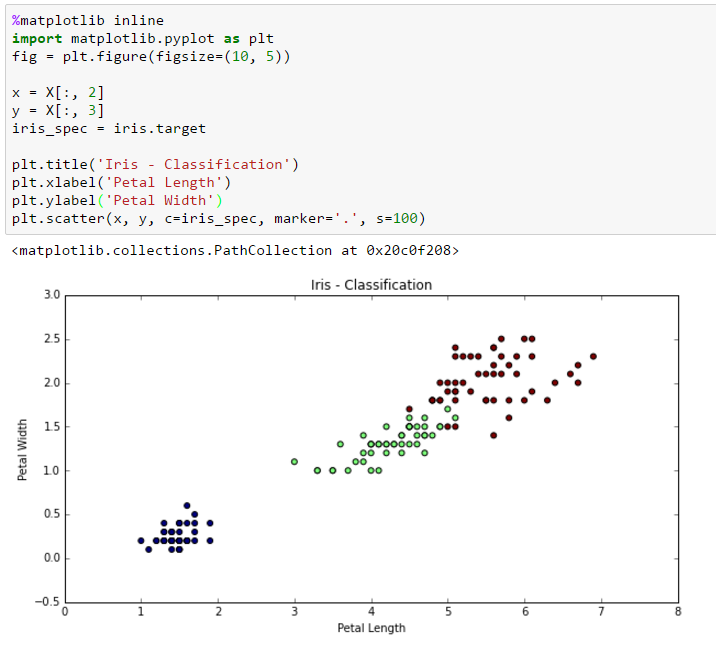
To get a better picture of our data we click on the circle of our data set and visualize it:

Here we can see each of the columns and easily gain helpful insights. In a real experiment we’d spend much more time playing with this important tool. For example we can directly compare two columns. Just select one of the available entries in the compare to-dropdown on the right.
Using Machine Learning Algorithms
We now know that we have to estimate continuous values and therefore have to use Regression Models. But because there are many of them available we also know that not all of them are equally powerful or well-suited for our concrete task. Therefore we’ll reuse our train/test data to evaluate different Regression Models before we decide which one of them we’ll utilize in our public web service.
Just imagine you were developing a web service for an insurance company which wants to calculate the insurance sums for different cities and their suburbs. You’d begin with some raw data describing housing prices for many different states, counties, cities etc. Based on this data you’ll develop your models and provide a publicly available web service. The ideal service from your customers’ perspective would be a web service that accepts values like city name and suburb and returns a housing price which then can be used for final insurance sum estimations on your customer’s side. Any time your original data changes, or when you change your ML models and other algorithms, you’d simply update this web service without disrupting your customer’s business processes. All they have to know are the parameters to feed your service’s API. Soon we’ll see how to accomplish this task with Azure ML. But first, let’s build two Training Models.
The first one is the Linear Regression:

At the first sight the combination may seem a little confusing but it’s actually a very simple task. Above we have the prepared data (Split Data) and we connect its output (left circle) to the second input of Training Model. The left input of the Model is the Linear Regression Algorithm which we get from the Azure ML Toolbar. In the end the Training Model is nothing else but a combination of Training Data (from Split Data Module) and an algorithm of our choice. In this case we decided to use Linear Regression. This is how we train our models. We use some data and combine it with one of the available ML algorithms. The end result is the Trained Model:

We apply the same strategy to generate another trained model. This time with Decision Forest Regression:

Both of the Regressions can be manipulated by setting their parameters. This is how my properties look like:


Finally, we want to score and evaluate our models. The individual scores of or our two models will be compared so we can decide which one of them should serve as the basis for our public web service. But take care of connecting the proper inputs/outputs because the final estimations are based on the previously generated test data in the Split module. I’ve put some blue/red squares around the circles to make the data flows easier to recognize.

Now it’s time to generate our models, to train and to evaluate them. We click on RUN at the bottom and wait for a few moments for processes to finish. Finally we click on the output circle of Evaluate Model and select Visualize:

We clearly see that the Forest Regression delivers much better results (smaller error values). We now know which model we have to use to power our public web service.
Publishing Predictive Web Services
Because we use more than one Model in this experiment we have to select the Forest Regression Train Model to let Azure ML know which one should be use to generate the new web service. Then we select the option Predictive Web Service at the bottom:

You’ll see a short animation like this:
You’ll also notice that Azure ML didn’t change the original experiment but instead generated a new one of type Predictive Experiment set to the Web Service View by default. There’s a switch for the two views: Experiment and Web Service (red area). Also notice the faded out icon of the original Boston Data which should never be removed because the service will need the schema information of the original data set.

Now we want to deploy our Web Service. We click on RUN to generate its structure and then on Deploy Web Service. A successful result should be like this:

Here we see the API description of our predictive web service and how to utilize it. We can also directly test it and get its documentation by clicking on the API help links below:
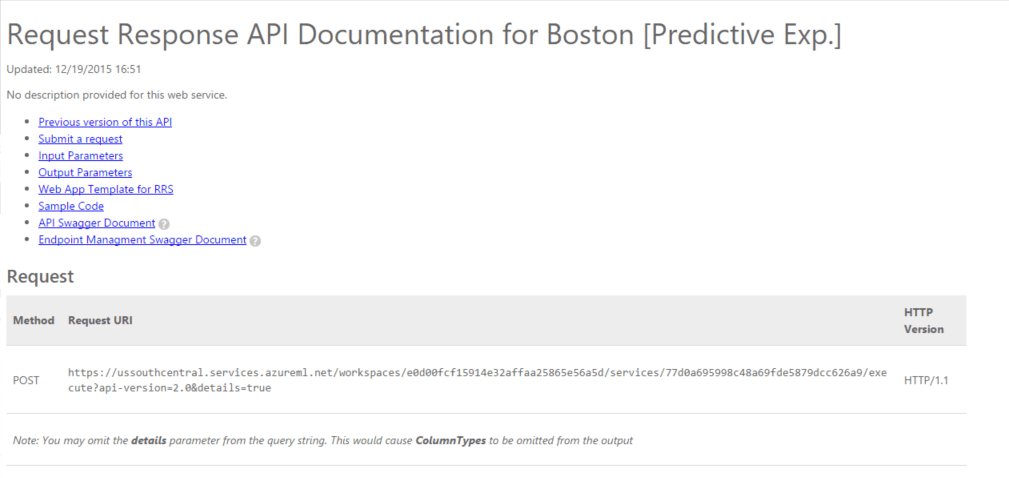
In the API docs you can find complete coding examples in C#, Python & R. Just copy/paste them and you’re ready to test the service. However, I prefer to use specialized tools like Fiddler or Postman to track the communication completely.
Accessing the Predictive Web Service
To successfully access the web service you’ll need three important elements:
- The URL for the POST Request from the docs.
- The prepared Request Body which is located below the POST request.
- The Authorization Bearer Token which is located on the service dashboard.
Here I’m using Postman but any other HTTP-Testclient like Fiddler should be just fine:

Be careful when setting the Authorization Bearer token. Don’t forget to add Bearer and the actual Token Hash separated by white space.
In the Body of the message just copy/paste the default values. You can change some of the fields to see the changes in the returned results. Of course, this is just a simple test and a real-world ML service would have a properly defined API with a predefined set of mandatory and optional values.
This is how your Body Content would look like. Don’t forget to set MIME-Type to application/json.

Now let’s fire a POST-Request! 😀
The returned result would look like this (I collapsed the complete result here):

Conclusion
Azure ML makes it possible to create complex models and even web services without touching the machine learning algorithms directly. This, of course, should not lead to assumption that all models can be trained like those presented here. I don’t believe that we can train sophisticated models without laborious data munging and code development. The above examples should serve more as a show case on how easy it is to bring all the different parts of the machinery together. Setting up the mechanism is not an easy task and dealing with all the libraries, remembering algorithms, chaining them together is often a repetitive an error-prone task. Exploring things is something most humans like to do and there’s really no shortage of curiosity but I doubt there’s much fun in creating the exploration machine itself. Ideally, we want the machine that is flexible enough so we can experiment in every possible way. When it comes to Azure ML I have to admit that I’m still a novice but because it’s so easy to play with it I’m sure I don’t have to give up quickly only because some experiment didn’t worked as expected.
Also I want to mention the really nice gallery where you can find many cool experiments or even publish your own. Azure ML itself is young and will need some time to reach the “critical mass” of real Data Scientists but regarding the fact that Microsoft is the new Mozilla (I’m quoting Brendan Eich here) and honestly supporting open source there’s no doubt that a many professionals will use this powerful technology.


