3 minutes read
This should have been the third part of the Loser’s article series but as you may know I’m trying very hard to keep the overall quality as low as possible. This, of course, implies missing parts, misleading explanations, irrational examples and an awkward English syntax (it’s actually German syntax covered by English-like semantics 😳 ). And that’s why we now have to go through this addendum and not the real Part Three about using Apache Spark with IPython.
The notebook can be found here.
So, let’s talk about a few features from Pandas I’ve forgot to mention in the last two articles.
Playing SQL with DataFrames
Pandas is wonderful because of so many things and one of the most prominent features is the capability of doing SQL-like selections, creating filters and groups without resorting to any SQL-dialect. Here’s how we chain multiple boolean selectors into one query on a DataFrame:

Grouping entries is equally simple:

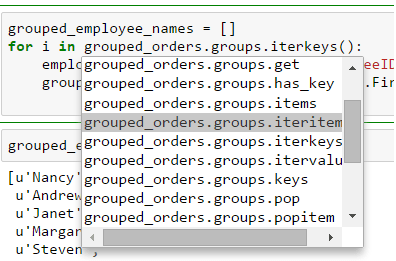
And grouped data can be iterated over by using either iterkeys, itervalues or iteritems
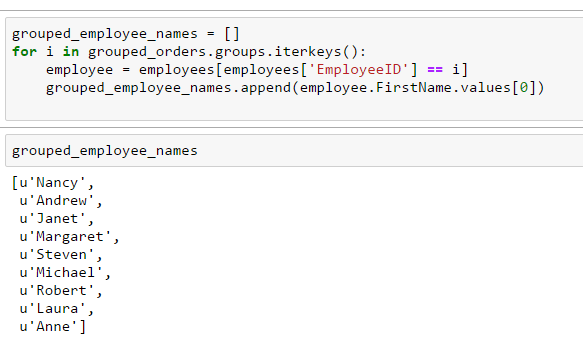
In this example we use an iterator as a filter. The iterator provides us employee IDs which are being used to select certain parts of Employees-DataFrame:
Using lambdas for more concise code is possible, too:

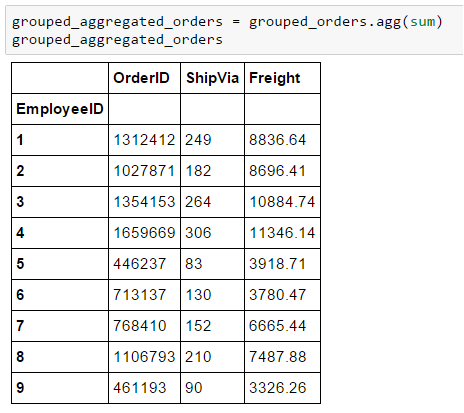
Here we iterate over the values and map group-IDs from GrupedOrders-DataFrame to the index-based locations in OrderDetails-DataFrame. We can pass the groups certain aggregate-functions too.
An example with sum.
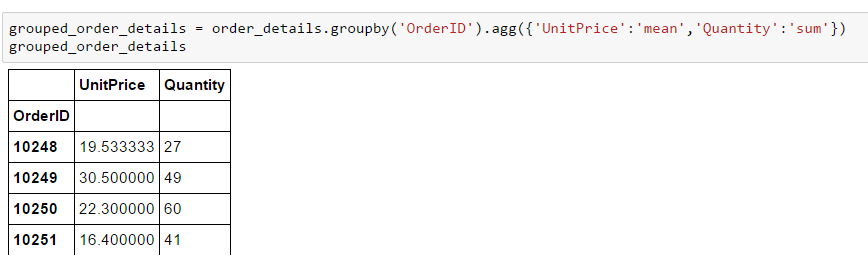
But we are not constrained to only one function per call. We can define dictionary objects mapping columns to functions. This is how we calculate means of unit prices and sums of quantities.
A DataFrame can be reindexed very easily. We can also define fill-values to be applied whenever a value is missing. This looks way better than colons of NaN-entries throughout the table.

If we omit certain indices pandas will adapt accordingly. If we later bring back an index entry the hidden values will instantly show up. Just leave a few values out and experiment a little bit.
Creating Panels
Series and DataFrames are the two most known structures in Pandas. But there’s another one: Panel. Panels can hold three-dimensional structures which comprise:
- an item axis, whose entries are DataFrames
- a major axis, whose entries are DataFrame rows
- a minor axis, whose entries are DataFrame columns
These DataFrames are related together and Panels maintain the correspondence between the index and column values. Here we define a Panel containing three DataFrames:

We see that the first DataFrame owns a full view on the available structure. The other two can only access certain parts of it an when we iterate over the items of the Panel, i.e. its DataFrames, the output differs accordingly:

We see that the first output slot, belonging to first_DF, shows all of the selected rows and columns. The other two slots only show some of available values across the rows and columns:
- Slot 2 has no access to rows 2 and 4 because in the definition above the second_DF only partially accesses indices 0,1 and 3. Its column rand1 is empty.
- Slot 3 has no access to rows 0, 1 and 3 because of its definition, third_DF. The columns rand0, rand1 and rand3 remain completely empty and only rows 3 and 4 under column rand3 contain values.
3D Panels are complex and can’t be easily displayed on screen. However, they are very powerful and allow to control relations that need more than two dimensions. For example time-frame dependent data, like historical stock prices in finance.
Conclusion
Of course, there are almost uncountable options, functionalities and other constructs in Pandas and NumPy and I can only hope we’ll see more of them while I’m writing these articles. But as promised the next “episode” will be devoted to Apache Spark and its usage via IPython (Jupyter).
Maybe I should write a few words about Scala? What do you think?
I would appreciate your feedback (not only regarding Spark & Scala but in general).


2 thoughts on “Data Science for Losers, Part 2 – Addendum”
Thank you 😀
Forget about Scala, PySpark is fine 🙂