Let me start this article describing the problem I had with finding a proper title for it. As some of you may already know I write a series called “Data Science for Losers” which comprises of several articles that describe different tools, methods and libraries one can use to explore the vast datascientific fields. And just a few days ago, while finishing my Data Science and ML Essentials course, I discovered that Azure ML has a built-in support for Jupyter and Python which, of course, made it very interesting to me because it makes Azure ML an ideal ground for experimentation. […]
statistics
5 posts

Sometimes, the hardest part in writing is completing the very first sentence. I began to write the “Loser’s articles” because I wanted to learn a few bits on Data Science, Machine Learning, Spark, Flink etc., but as the time passed by the whole degenerated into a really chaotic mess. This may be a “creative” chaos but still it’s a way too messy to make any sense to me. I’ve got a few positive comments and also a lot of nice tweets, but quality is not a question of comments or individual twitter-frequency. Do these texts properly describe “Data Science”, or at […]

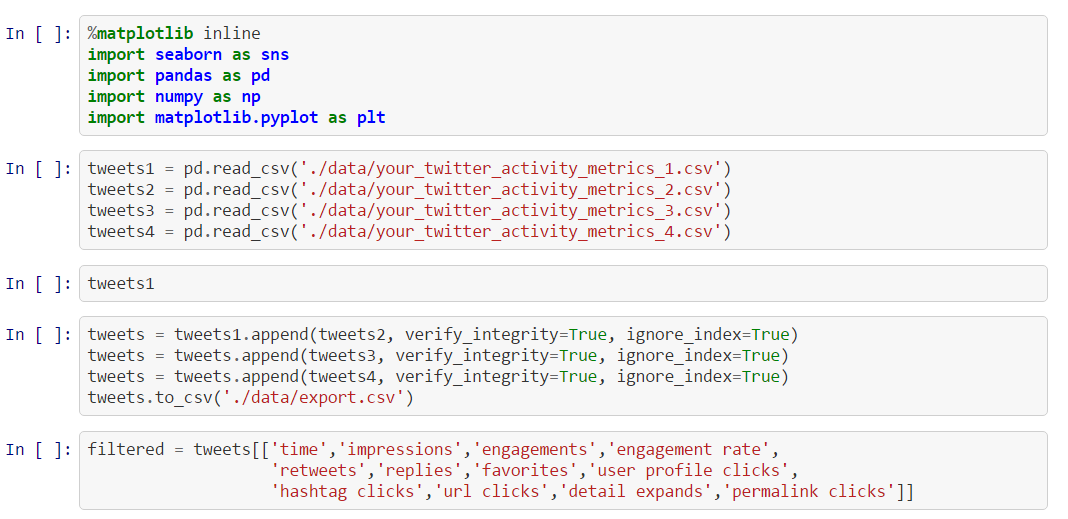
This should have been the third part of the Loser’s article series but as you may know I’m trying very hard to keep the overall quality as low as possible. This, of course, implies missing parts, misleading explanations, irrational examples and an awkward English syntax (it’s actually German syntax covered by English-like semantics 😳 ). And that’s why we now have to go through this addendum and not the real Part Three about using Apache Spark with IPython. The notebook can be found here. So, let’s talk about a few features from Pandas I’ve forgot to mention in the last two articles. Playing SQL with DataFrames Pandas is wonderful because of […]

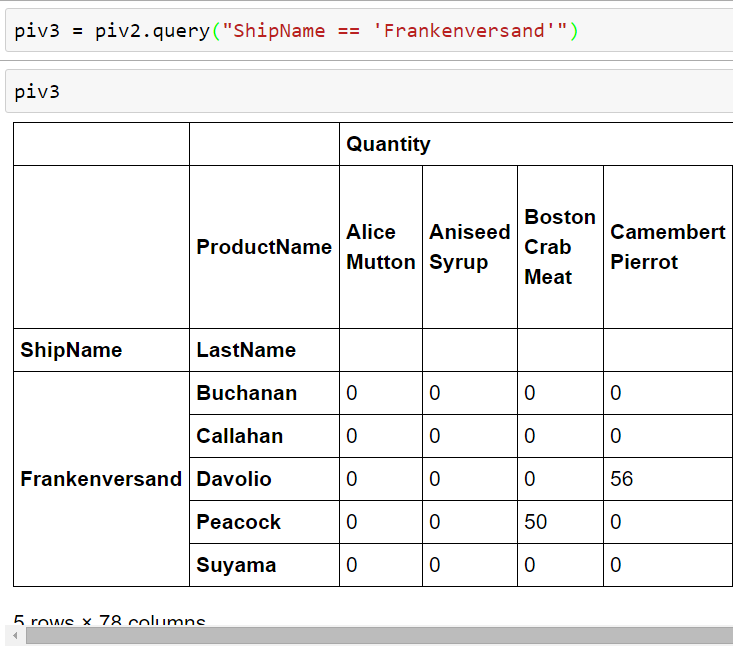
In the first article we’ve learned a bit about Data Science for Losers. And the most important message, in my opinion, is that patterns are everywhere but many of them can’t be immediately recognized. This is one of the reasons why we’re digging deep holes in our databases, data warehouses, and other silos. In this article we’ll use a few more methods from Pandas’ DataFrames and generate plots. We’ll also create pivot tables and query an MS SQL database via ODBC. SqlAlchemy will be our helper in this case and we’ll see that even Losers like us can easily merge and filter SQL tables without touching the […]
Anaconda Installation To do some serious statistics with Python one should use a proper distribution like the one provided by Continuum Analytics. Of course, a manual installation of all the needed packages (Pandas, NumPy, Matplotlib etc.) is possible but beware the complexities and convoluted package dependencies. In this article we’ll use the Anaconda Distribution. The installation under Windows is straightforward but avoid the usage of multiple Python installations (for example, Python3 and Python2 in parallel). It’s best to let Anaconda’s Python binary be your standard Python interpreter. Also, after the installation you should run these commands: conda update conda conda update “conda” […]