9 minutes read
In the first article we’ve learned a bit about Data Science for Losers. And the most important message, in my opinion, is that patterns are everywhere but many of them can’t be immediately recognized. This is one of the reasons why we’re digging deep holes in our databases, data warehouses, and other silos. In this article we’ll use a few more methods from Pandas’ DataFrames and generate plots. We’ll also create pivot tables and query an MS SQL database via ODBC. SqlAlchemy will be our helper in this case and we’ll see that even Losers like us can easily merge and filter SQL tables without touching the SQL syntax. No matter the task you always need a powerful tool-set in the first place. Like the Anaconda Distribution which we’ll be using here. Our data sources will be things like JSON files containing reddit comments or SQL-databases like Northwind. Many 90’es kids used Northwind to learn SQL. 😎
The notebook from this article can be found here.
Analyzing Reddit comments
Our first analysis will use 10.000 comments from a reddit backup. More specifically, we will use 10.000 comments from August 2015. There are many more gigabytes of reddit’s backups available, so feel free to download entries from other time periods. If you prefer Torrent here’s the link. You can also query these data sets via browser by using Google BigQuery. In the end you should have a JSON file containing many entries which we’ll try to load into a DataFrame. But as we’ve already learned most data is not in the format we expect it to be. Sooner or later we’ll have to structurally modify our data. Here’s a snippet of our reddit JSON:
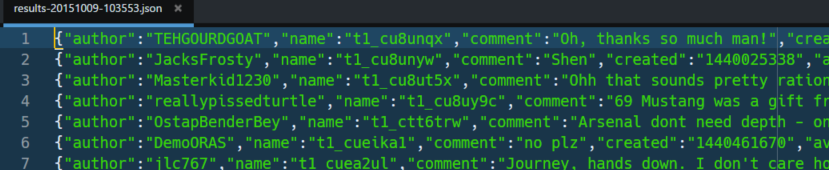
Well, this isn’t a proper JSON and Pandas would immediately reject it. Let’s just try to load it just to see what happens.
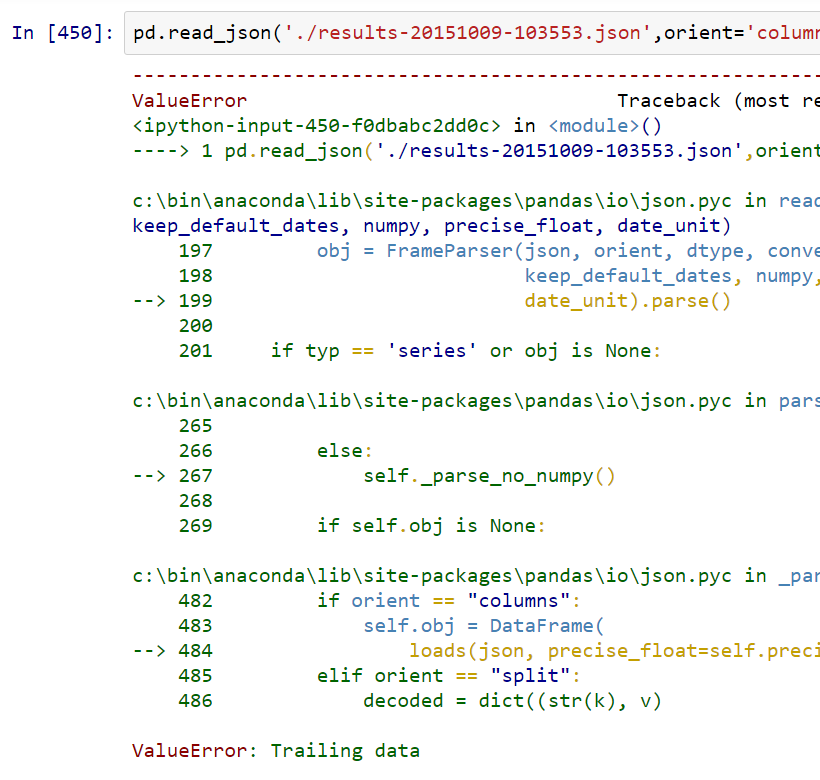
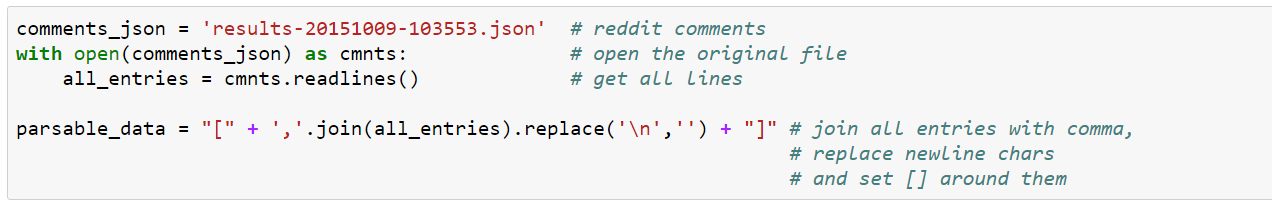
Well, not a good impression. Pandas sees some trailing data which by itself is misleading enough. But when a machine complains wrongly why should be expect our data to be correct anyway? We have to accept the fact that these entries only seemingly look like a JSON structure but surely don’t follow the JSON standard itself. A collection of JSON objects, that is: reddit comments, has to be inside an JSON array (square brackets, []) and must be separated by commas. Do we see any commas in the document? Yes, but only inside the entries themselves and not between them. And where’s the array comprising of all reddit comments? No square brackets in sight. So, what are we going to do now? Converting raw data into a readable format, of course. In this case we’ll use a simple Python snippet to read the comments one by one, put a comma in between, remove any newlines and put the comments into a new array.
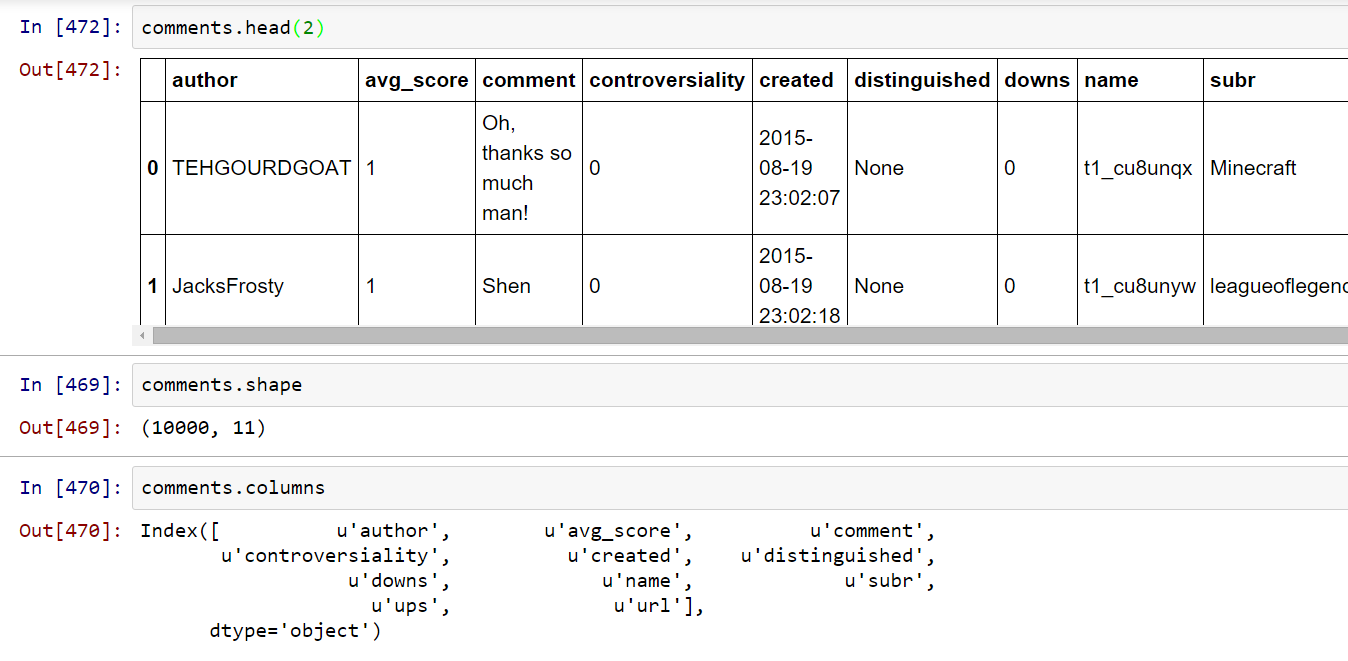
Now we can load all comments into a DataFrame but we also have to give Pandas a little more info than usual. This is because it doesn’t know in advance what the internal JSON-structure looks like. Is it a flat array containing only single entries? Or a dictionary? Or something like objects with properties? Therefore it isn’t enough just to type in pd.read_json and expect it to load the unknown structure somehow. Instead we have to type in a command like this:

Pandas can load JSON’s either as Series or as DataFrames depending on the internal structure of the document. In our case we want to generate Tables and therefore we want to receive a DataFrame. For this we need a proper orientation of our data. Therefore we instruct Pandas to use the column orientation. Finally, we want a certain column containing timestamps to be parsed as a date entry. Finally, we check the basic properties of our new DataFrame:
Now let’s create a horizontal bar-plot showing the highest rated comments for all available sub-reddits:
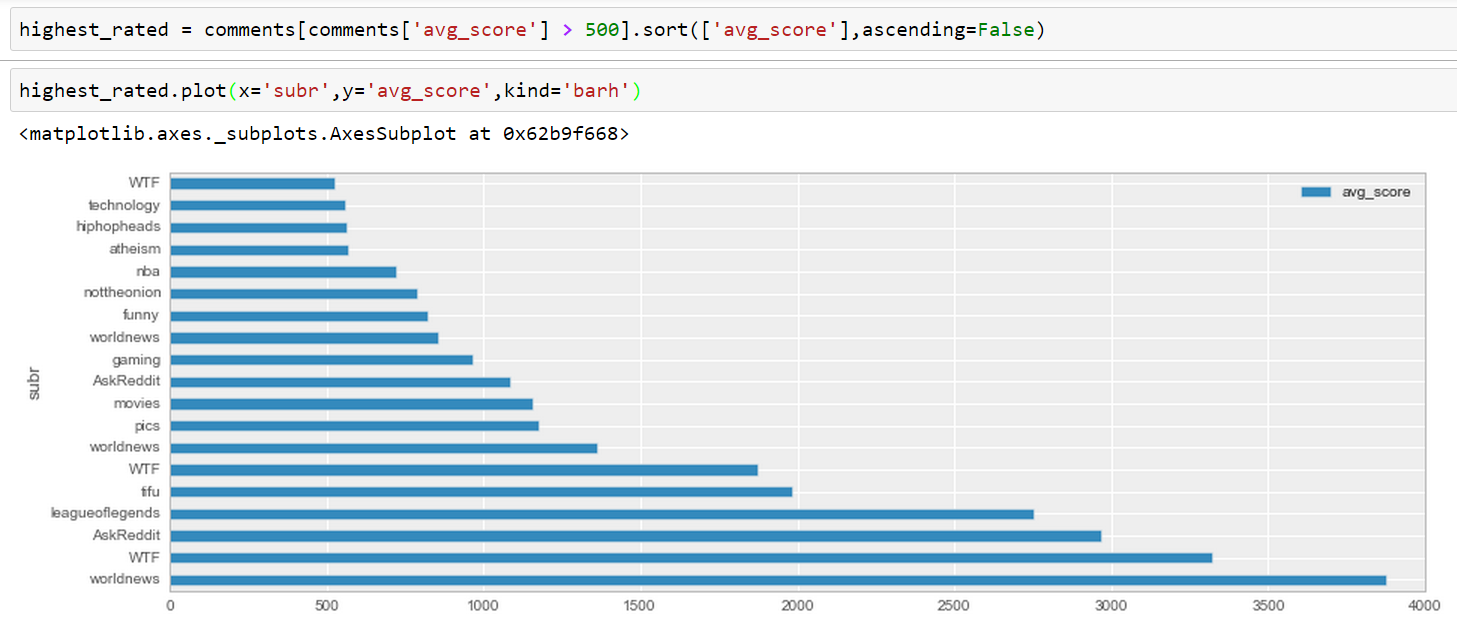
Nice, how quick we’ve got from an unreadable JSON to a plot! And now for something completely different: pivot tables.
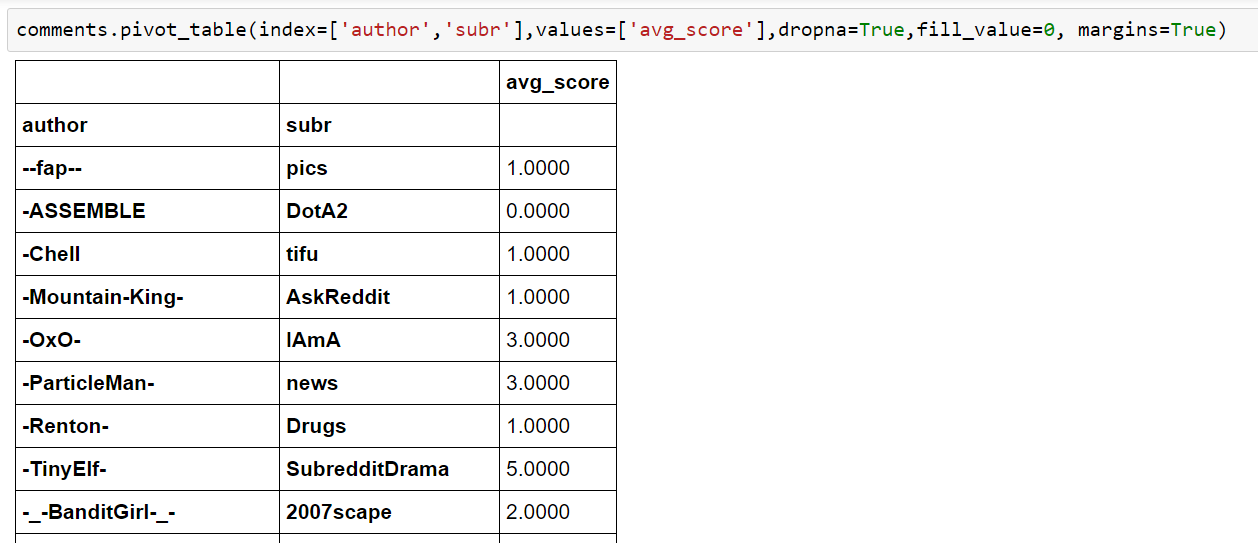
Nice, but what’s a pivot table by definition? Honestly, we could fill at least a book about it but let it be said that a pivot table is an automatic data summarization, grouping, filtering and counting tool. Pivot tables visualize data that automatically adjust itself according to given rules, dimension and filters. For example we decide that it should show the controversality column of every comment.
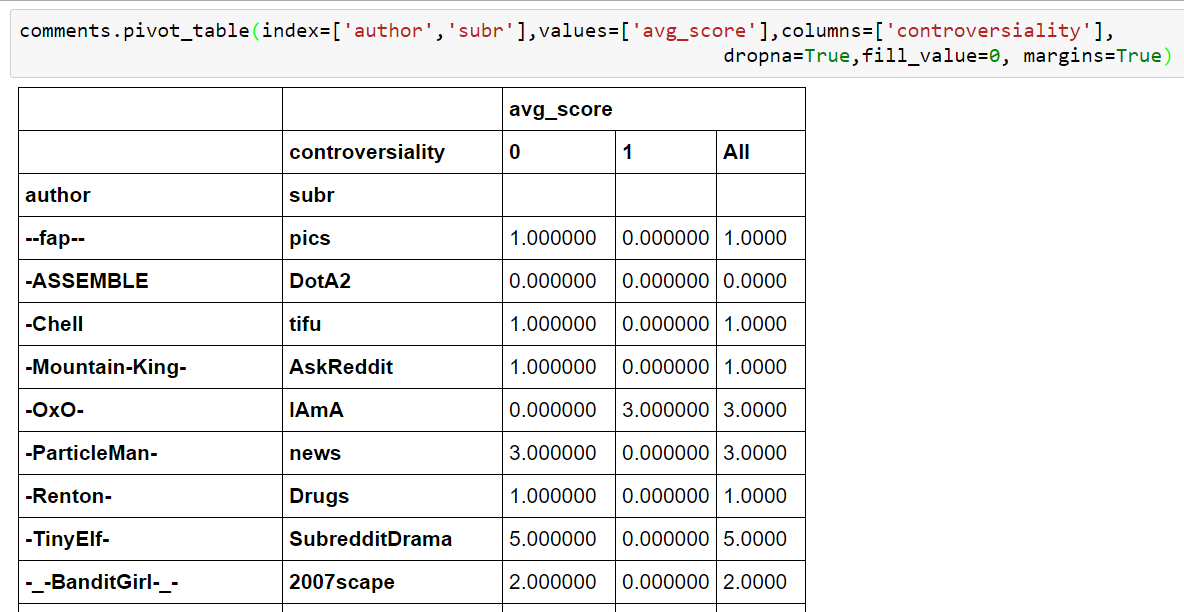
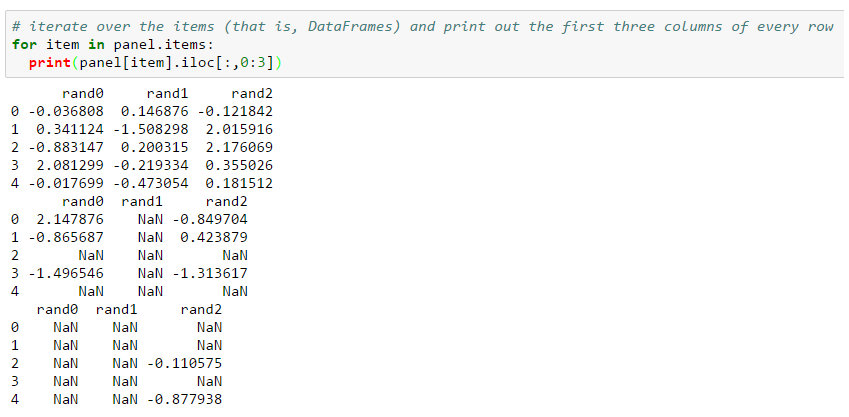
What happens here is that for the two given indices author & subr there will be a column controversiality. But this selection is not very useful because our index starts with author. There are many authors and much less sub-reddits. Let’s change the order and look at the outcome:
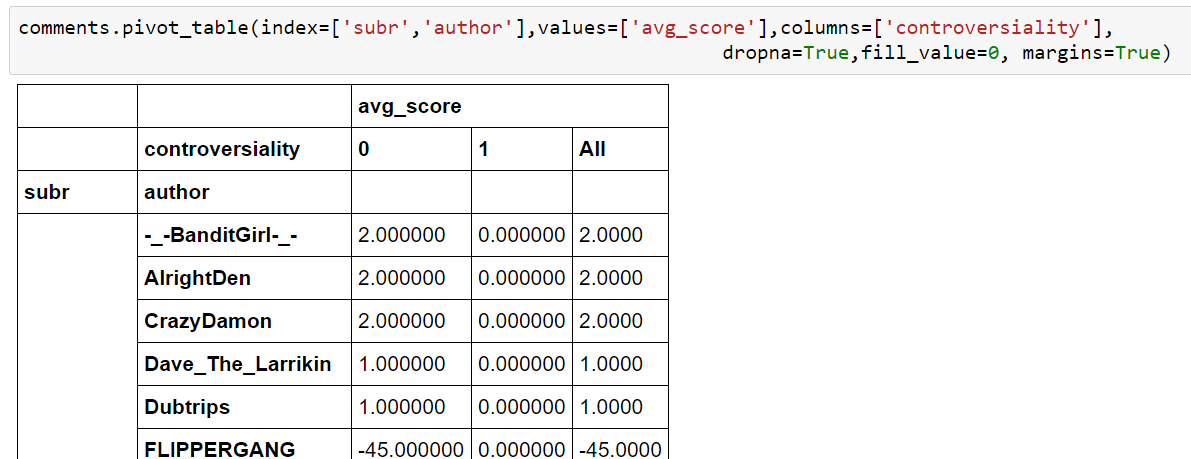
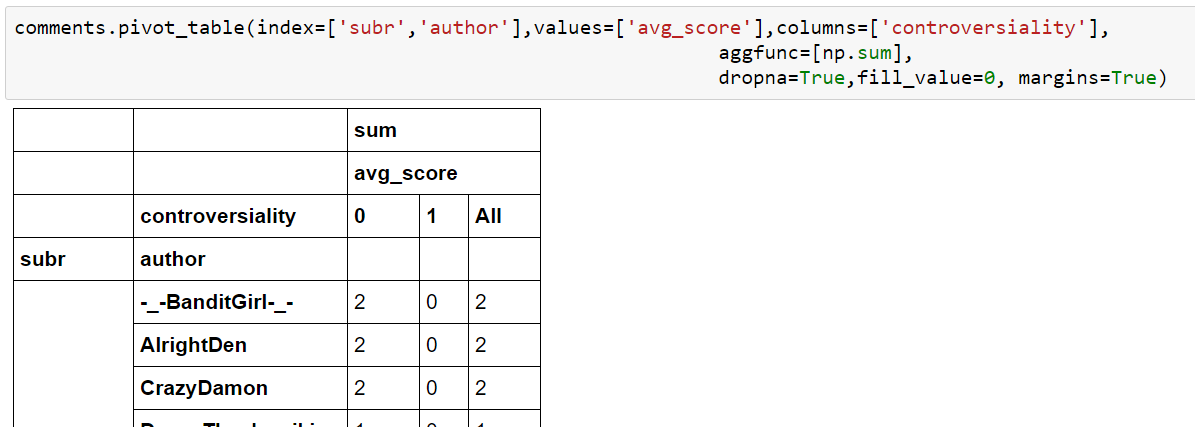
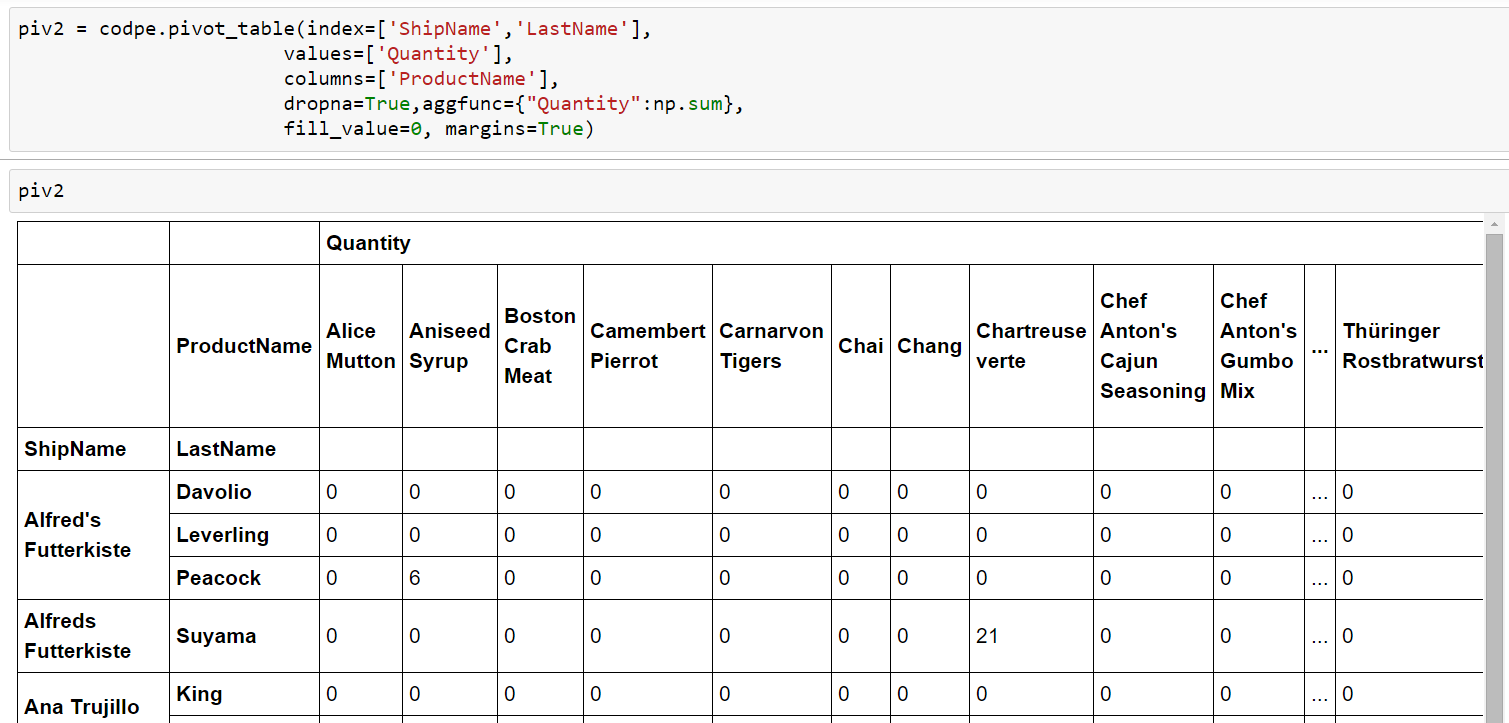
This now is something completely different because our authors are grouped by subreddits. It makes a lot more sense because we can expect many authors to visit different sub-reddits and not only one. Also we have to take into account that the many zero-values are not there because JSON file contained them but because we’ve used the option fill_values=0. Without it the pivot would be filled with NaN’s. The last parameter margins=True calculates the “totals”. There are many more options, of course. For example, we can instruct Pandas to use certain aggregate functions on every field or only some of them. Here we want Pandas to calculate sums:
And suddenly, our pivot table looks a lot nicer. No more useless zeroes all along the way. We can add more than just one aggregate function. It’s even possible to create a dictionary of aggregate functions. The column would be the key-entry in the dictionary and the function its corresponding value. Here we let Pandas calculate mean-values:
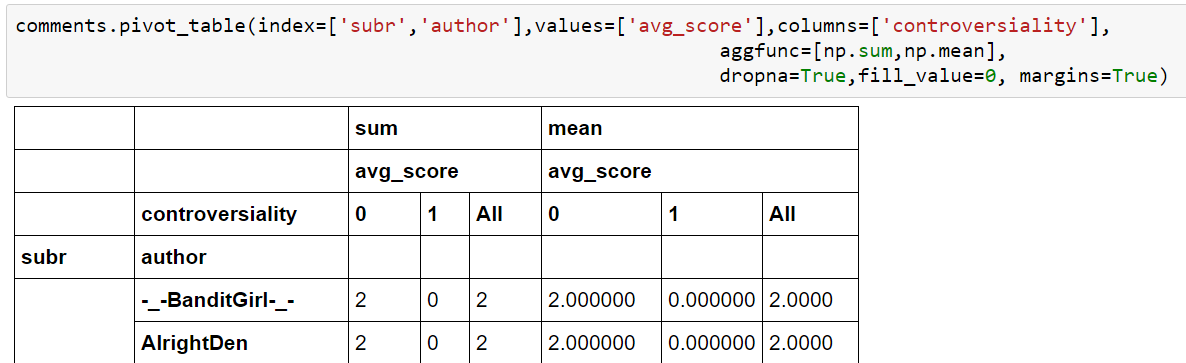
OK, the outcome is pretty silly, but you get the point. It’s a Loser’s way to a higher knowledge, anyway. 
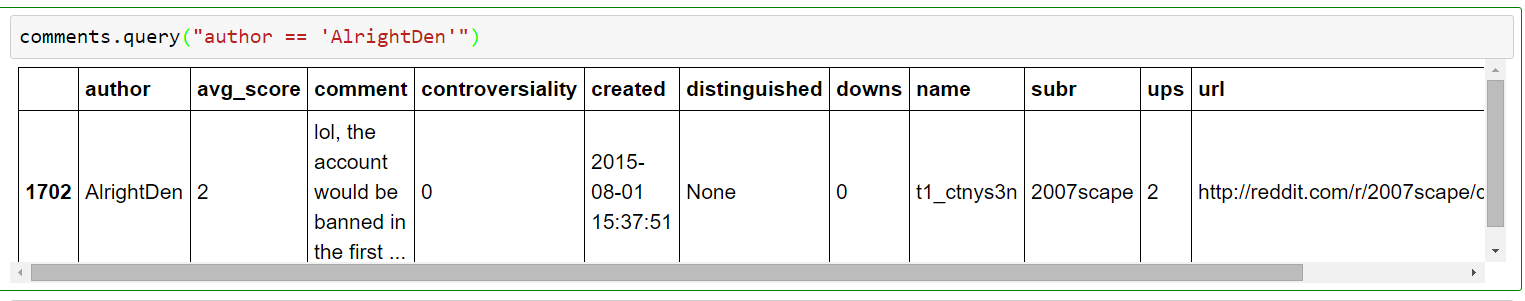
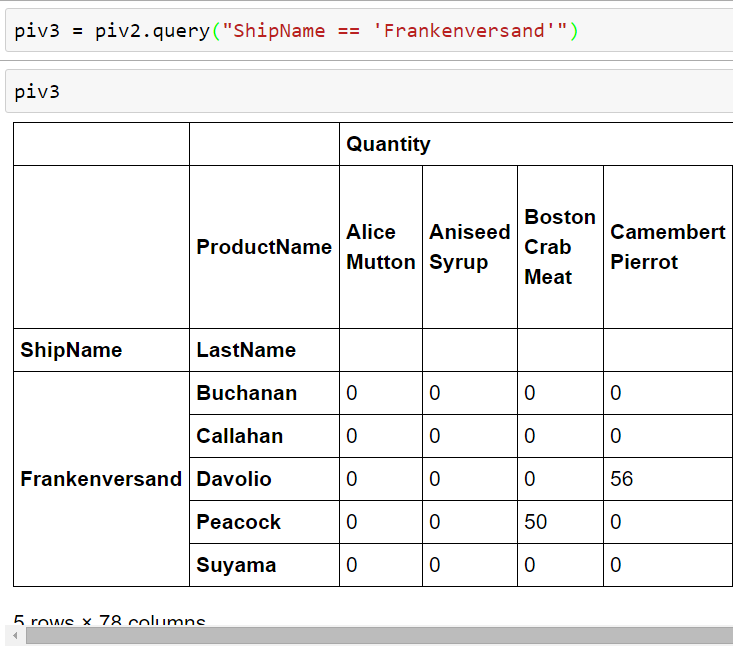
A pivot table can be used like any other data source, too. You can execute queries against it and do all the nice filtering stuff as if it was a database.
Querying Databases with SQLAlchemy and pyODBC
Again, SQLAlchemy is something that surely deserves a book or two and therefore I’m not going to talk too much about it because it simply doesn’t fit into a simple tutorial like this. In our case all we have to know is that SQLAlchemy is a powerful Python package giving us the possibility to query any kind of database without touching its vendor’s specifics. For example, here I’m using an MS SQL Server (just to annoy the most of you) and access it via ODBC (yes, still annoying you!). The ODBC setup can be a little bit daunting so let me quickly explain how to do it under Windows:
- Open ODBC Data Sources (just type in ODBC in Windows Search)
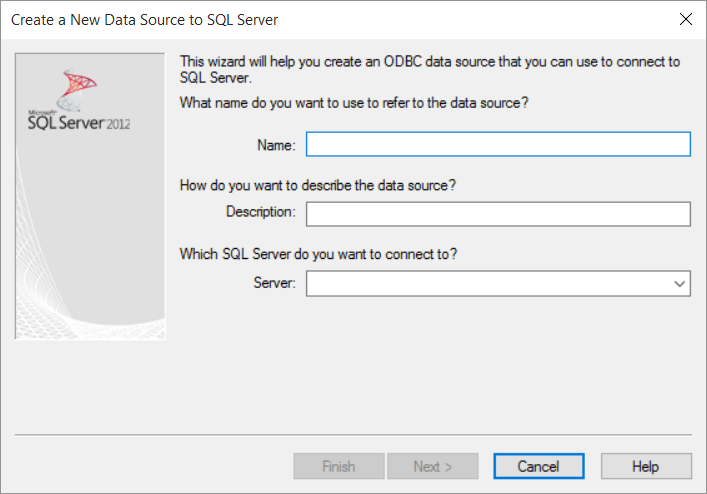
- In the new window click on Add and then select “SQL Server Native Client”
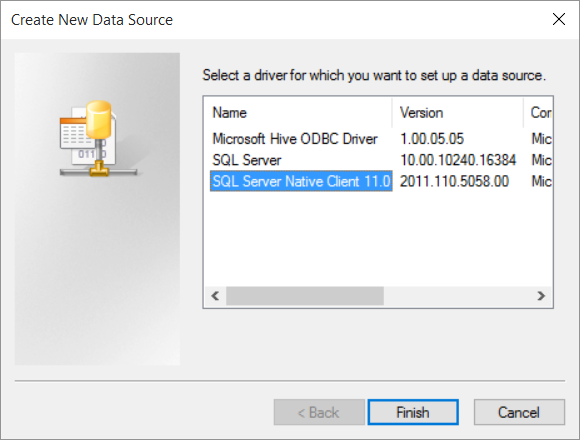
- Click on Finish and then add your data source information: a new name, a description and the full server name like HOSTNAME\SQL-SERVER-NAME
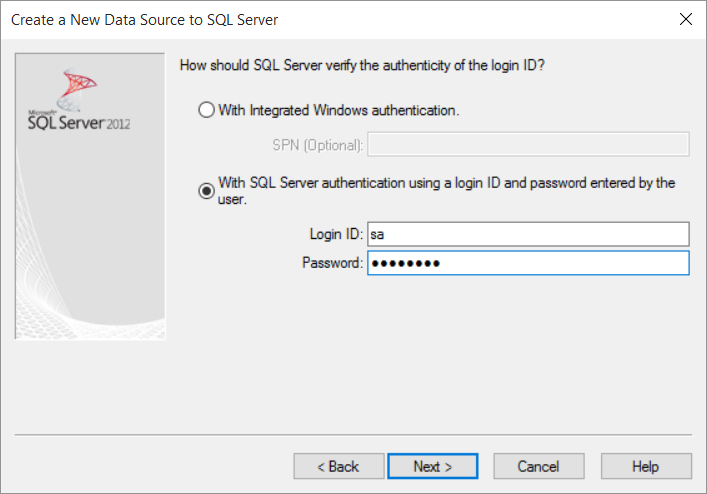
- Click on Next and type in your user/password in the next window (it depends on how you access your MSSQL, integrated or SQL-Auth)
- In the next window activate the checkbox “Change the default database to” and select NORTHWIND (download it from here and restore it in MSSQL Manager if you don’t have it already running in your db-server)
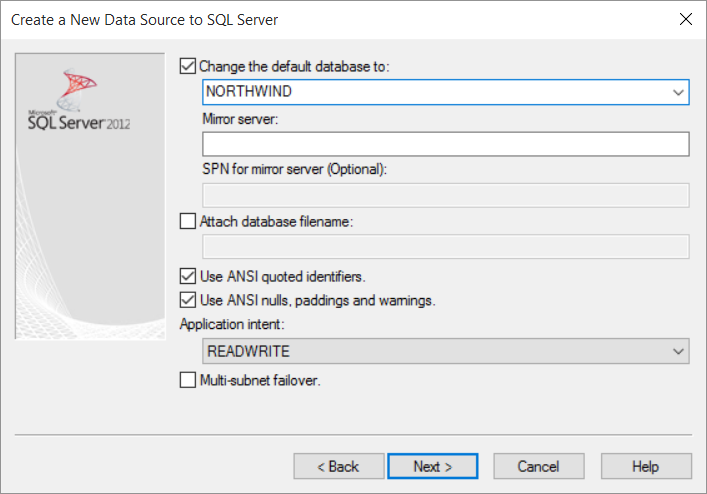
- Now just click on Next and then on Finish. You can optionally test the settings in the last window presented.
OK, hopefully it wasn’t too annoying. 🙄
We now have to configure SQLAlchemy to talk to our new ODBC resource:
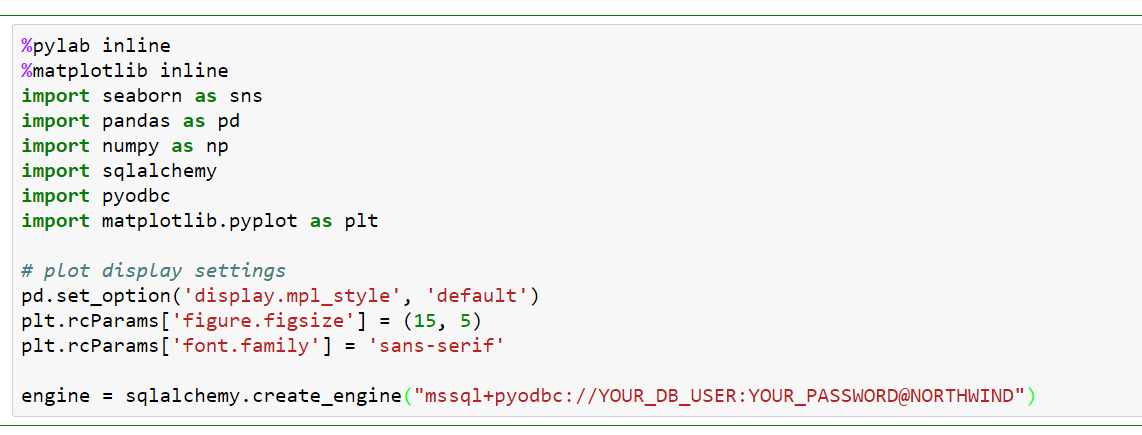
Here we see many other “standard” imports like those with Pandas, NumPy etc. But at the bottom we additionally configure SQLAlchemy. The pyODBC package is needed too, because SQLAlchemy uses it to create an ODBC context.
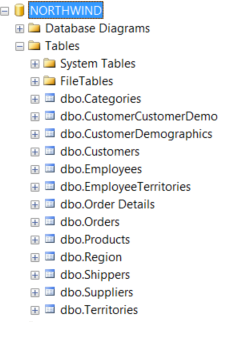
SQLAlchemy offers the method create_engine which we have to feed with a special connection string containing the name of the database driver, in this case mssql+pyodbc, the database catalog information and its access tokens. The result of this call will be a reference to an engine object maintaining a connection to the given database catalog. This is how the structure of the NORTHWIND catalog looks like:
First, we let SQLAlchemy access certain tables from the catalog:
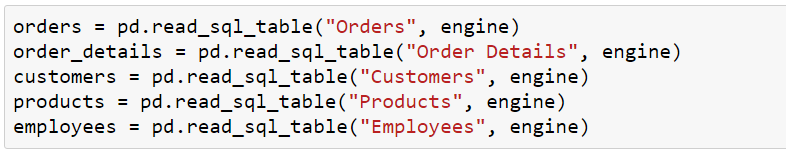
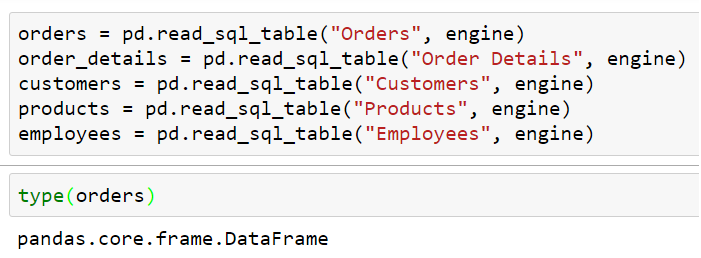
We access tables with SQLAlchemy by providing their respective names. The second parameter, engine, maintains the physical connection against the catalog. The resulting references are just normal DataFrames which is of course an important advantage of Pandas. No matter what type the original data source is in the end everything ends up in a DataFrame. Or Series if we’re not maintaining multidimensional structures.
We can now execute methods that resemble behaviors known from ordinary databases. For example, Table Joins via merge:
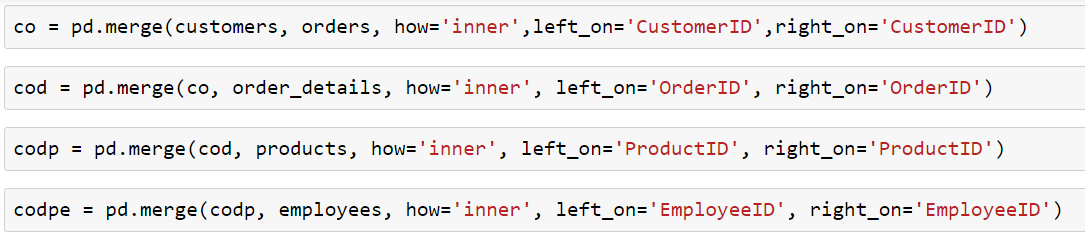
Here we instruct Pandas to merge two tables by using certain primary keys from both when combining their rows into a new table. The parameter how instructs Pandas to use the inner-join which means it will only combine such rows which belong to both of the tables. Therefore we’ll not receive any NaN-rows. But in some cases this could be desirable. Then use the alternative options like left, right or outer.
Pivots with Tables from SQLAlchemy
And of course it’s possible to generate the same pivot tables with data that came from SQLAlchemy. They’re nothing else but DataFrames all the way down. OK, not absolutely all the way down, because there are also Series and NumPy arrays etc., but this is a little bit too much of knowledge for Losers like us. Maybe in some later articles.
Here we let an aggregate sum-function from NumPy be only executed on Quantity fields. Being armored with some knowledge from the previous pivot example it shouldn’t be that hard to create own pivot’s. And of course, we can query pivot tables, too. 😎


2 thoughts on “Data Science for Losers, Part 2”
I think this is a better way to join the lines of json:
“`
import json
def join_json(filename):
with open(filename) as handle:
return [json.loads(line) for line in handle]
“`
Hi Hugh,
Thanks for the code snippet. Sure, here are many things which could be written in a more “pythonic” way.
The code is on GitHub so feel free to send a pull request (not only for this code part but in general).
Regards,
Harris